Advanced system settings
You can use specify flex.bi advanced settings in the config/eazybi.toml configuration file. The configuration file uses TOML format. Please see comments and commented examples for each section in this file.
Performance optimization and tuning
Increase query timeout
By default, there is 60 seconds query timeout after which report generated queries will be canceled. The purpose of this timeout is to avoid too long execution of too complex ad-hoc queries (when you join too many dimensions in rows or columns).
If you have reports that fail the query timeout error and you need help optimizing these reports, then please export and send the report definition to flex.bi support.
If you still would like to increase this timeout value then change the default 60 to a different value:
[mondrian]
"mondrian.rolap.queryTimeout" = 120
If you import data from SQL source you can increase the timeout with the following settings:
[source_application.sql]
connect_timeout = 20
read_timeout = 600
query_timeout = 600
Increase concurrent report queries
The default number of max concurrent flex.bi report queries is 10. If more MDX queries are made simultaneously, then new queries will wait until previous will finish.
If you have a powerful server with many CPU cores and you would like to allow more concurrent MDX queries then you can increase max queries value in eazyBI advanced settings with:
[mondrian]
"mondrian.rolap.maxQueryThreads" = 20
If you change several Mondrian settings then use just the one [mondrian] section.
Enable Mondrian debug logging
If you would like to debug Mondrian MDX queries, that are generated by flex.bi, or to see all executed SQL statements then you can enable Mondrian MDX and SQL logging with
[mondrian.log]
"mondrian" = "ERROR"
"mondrian.mdx" = "DEBUG"
"mondrian.sql" = "DEBUG"
You can see the Mondrian debug log in the log/eazybi-mondrian.log file.
Enable Mondrian request profiling
If you want to investigate Mondrian MDX queries and executed SQL statements for individual reports, then you can enable Mondrian request profiling with
[mondrian.profiling]
enable = "system_admin"
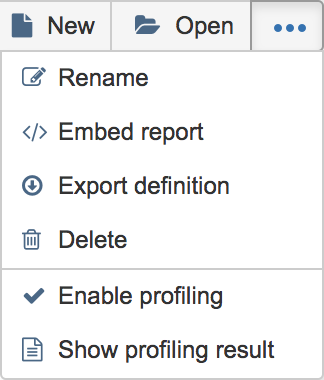
Then, go to the Analyze tab and Enable profiling in the other report actions dropdown. After that, every next request execution will be profiled and you can view the last profiling result with Show profiling result.
Please send the report definition and profiling result to flex.bi support, if you need help with report performance optimization.
Currently, Mondrian request profiling for reports in accounts with a custom schema will not include SQL queries that are generated by Mondrian. In other accounts, SQL queries are filtered by standard table schema prefixes but in custom schemas currently there is no standard way how to identify these Mondrian queries.
Background job queues
There are several background job queues in flex.bi:
- regular_import – for source application imports that are scheduled at a regular frequency.
- application_import – for source application imports that are started manually.
- file_import – for uploaded source file imports.
- dashboard_email – sending emails for dashboard email subscriptions.
You can see the status of background job queues from the flex.bi System administration / Background jobs page.
By default, one parallel background job can be executed in each queue. If you would like to increase the size of the queue, then specify size the setting for this queue, for example:
[job_queue.application_import]
size = 2
If you would like to limit that no background jobs are executed during some hours (e.g. during high load hours of Jira) then specify either disabled_hours or enabled_hours the setting, for example:
[job_queue.application_import]
disabled_hours = "9-18"
or
[job_queue.application_import]
enabled_hours = "0-9,18-24"
In both cases, manual data imports will not be done from 9:00 to 18:00 (using the Jira server time zone).
If you change disabled_hours or enabled_hours , then it will be checked every 10 minutes.
Enable Mondrian to debug logging
If you would like to debug Mondrian MDX queries, that are generated by flex.bi or to see all executed SQL statements then you can enable Mondrian MDX and SQL logging with
[mondrian.log]
"mondrian" = "ERROR"
"mondrian.mdx" = "DEBUG"
"mondrian.sql" = "DEBUG"
You can see the Mondrian debug log in flex.bi home directory log/eazybi-mondrian.log file.
SSRF protection
SSRF (Server Side Request Forgery) protection allows to prevent flex.bi REST API and SQL import from other hosts in the same local network where the flex.bi server is running. By default SSRF protection is disabled.
Enable SSRF protection with:
[ssrf_filter]
enable = true
If you would like to allow REST API import or SQL import access to some IP addresses in the same local network, then specify allowed_ip_addresses setting. In addition, you can specify restricted_ip_addresses to specify additional IP addresses (which are not in the local network) from which REST API import and SQL import should be restricted.
[ssrf_filter]
enable = true
allowed_ip_addresses = ["192.168.1.1", "192.168.8.1"]
restricted_ip_addresses = ["8.8.8.8", "8.8.4.4"]
In addition to this, you can use your own external proxy and then allow/restrict IP addresses in the proxy configuration. The proxy will only work for REST API import, not for SQL import.
[ssrf_filter]
enable = true
proxy = "127.0.0.1:3128"