What is a calculated member and when to use calculated members
This tutorial explains how to define new calculated members and measures using MDX expressions (or formulas). If those words do not make sense to you, we advise getting to know the main flex.bi concepts and learn how to create reports and then come back to this section again.
What is MDX?
MultiDimensional eXpressions (MDX) is a query language for querying and manipulating the multidimensional data stored in OLAP (online analytical processing) data cubes. MDX syntax is similar SQL syntax or to spreadsheet formulas. Below is an example of a very simple MDX query:
SELECT
   { [Measures].[Salesfact] } ON COLUMNS,
   { [Date].[2004], [Date].[2005] } ON ROWS
FROM Sales
MDX was initially developed by Microsoft for its SQL Server analysis products, though it has since become an independent standard. It's been around long enough now that there are many MDX tutorials and references, most notably:
-
http://msdn.microsoft.com/en-us/library/ms145506.aspx
-
http://en.wikipedia.org/wiki/Multidimensional_Expressions
MDX implementations vary, and many MDX documentation resources are specific to certain niche products or standards.
MDX Used in flex.bi
Calculated members and calculated measures can be used to add business logic to a report and a data cube. Most common use cases for calculated members and measures are to group particular items of interest, dynamically change time according to the current date or selected period and, most importantly, derive new measurements from existing data. Calculated members and measures are defined using the MDX (multidimensional expressions) query language which is the main query language implemented by Mondrian (https://mondrian.pentaho.com/documentation/mdx.php)
What you should know
Mastering how to write MDX expressions is initially quite difficult. Don't worry, you will get along quite well if you will follow some ground rules. MDX is a language and to use it for calculations it is enough to understand some base words (data types and functions) and how to use a dictionary (list of available functions).
Functions
A function is a mathematical or logical action that transforms data and then returns a modified version of data. In other words, some data goes IN, then function transforms them, and another data comes OUT. You can recognize function by the red color of the text and symbols defining the start and end of the function, brackets (), curly brackets {}, dot .For example, function DateDiffDays() calculates how many days are between two given dates. In this function goes IN two dates and comes OUT one number representing a count of days.
Data types
A data type is a particular kind of data item, as defined by the values it can take. In MDX you can use the following data types:
|
Number |
42, 91.6%, 17h 38m |
|
String |
"Guns N' Roses", "679864278" |
|
Date |
May 25 2018 |
|
Set - a collection of distinct objects |
{%,&,@,*,$,!} |
|
Member - something you can get as one row |
[Time].[Year].[2018], [Region].[Continent].[Country].CurrentMember |
|
Boolean - logical yes or no |
true, false |
Ground rules
-
Calculations that refer to members from several dimensions or numerical measures should be created as new user-defined measures in Measures. We call them calculated measures.
-
A measure binds data together and allows you to represent data from different points of view (Dimensions). Therefore, each calculated measure should contain at least one already existing measure or fixed value. Measure is a treasure!
-
When creating a calculated member in a dimension, use only members from one dimension where you create them. Don't mix dimensions in calculated members! We recommend using an aggregate function for calculated members and do not perform arithmetical operations, like, multiplying, dividing, and subtracting in those calculations.
-
Use tuples when possible.
-
Start simple and build calculated members and measures step by step adding complexity gradually.
Naming conventions
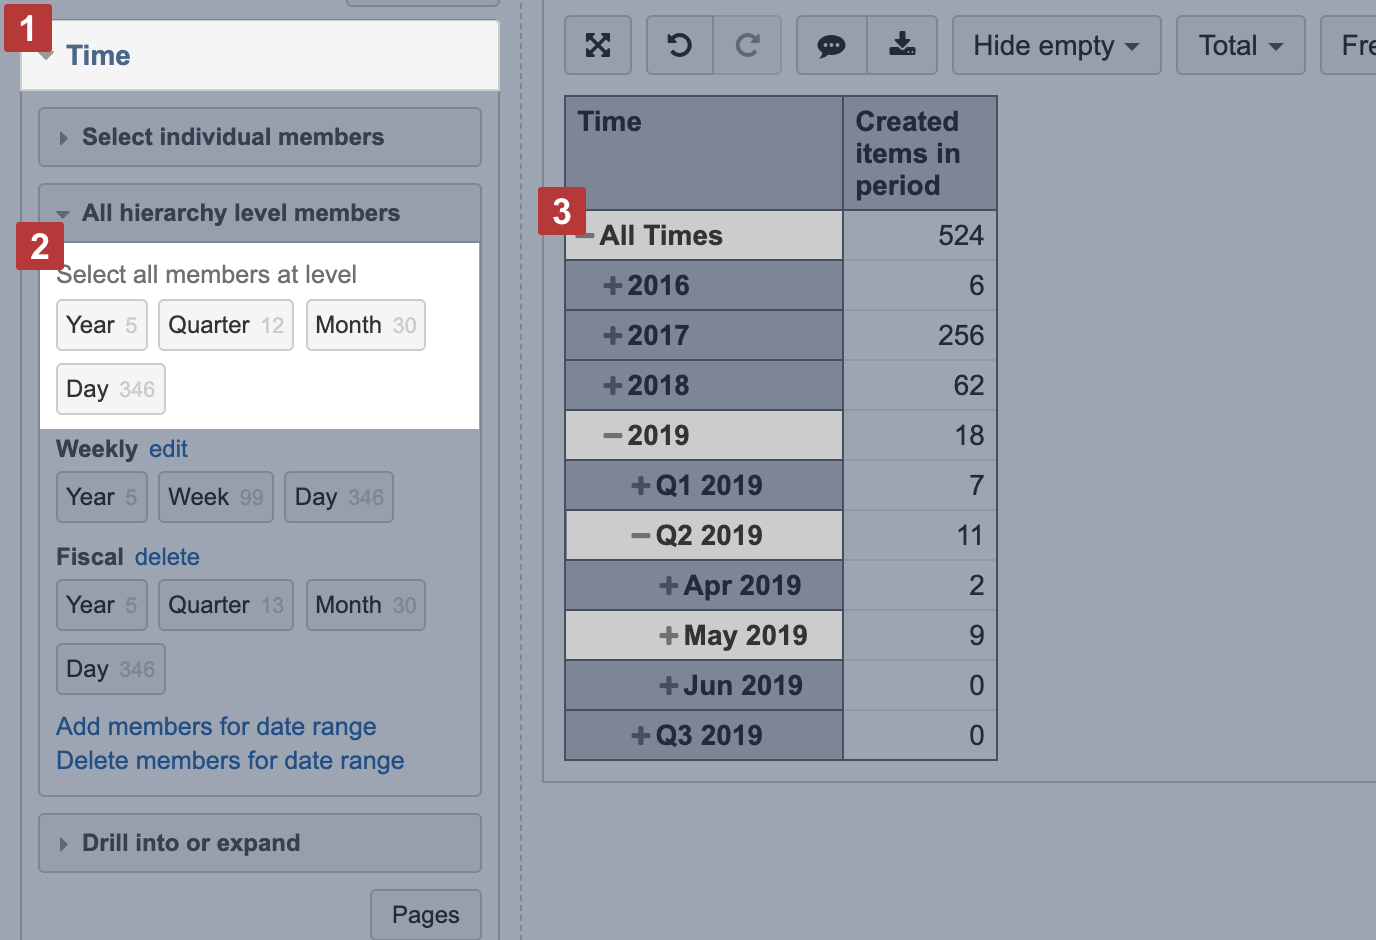
Each dimension [ 1 ] contains one or more hierarchies with one or more hierarchy levels [ 2 ], and each hierarchy level contains dimension members. When creating new calculated measures and members, we usually refer to the specific members with which we want the code to work. So we should show the full path on how to find that particular member. One way to identify a member is to start with the name of the dimension and work downwards, specifying the members at each level in the hierarchy [ 3 ] until we reach the required member.
For example, the Time dimension contains three hierarchies: default, Weekly, and Fiscal. Going further down the default hierarchy it has five levels: All Times (default level), year, quarter, month, day [ 2 ]. To represent a specific month of the year, the path to May 2019 would look like this:
[Time].[2019].[Q2 2019].[May 2019]
In MDX query language, all names of measures, dimensions, dimension hierarchies, hierarchy levels, and dimension members are enclosed in square brackets []. To reference a dimension, you just enclose its name in square brackets, e.g., [Customers], [Measures], [Time]. To reference a particular member, enclose each name of the path in square brackets, e.g., [Customers].[USA].[CA], [Time.Weekly].[2019].[W31, Jul 29 2019] or [Measures].[Store Sales].
-
If a dimension has just one hierarchy, it automatically is also the primary hierarchy. And you can refer to the primary hierarchy in the same way as a dimension by mentioning just a dimension name, e.g.
[Customers]or[Measures]. -
If a dimension has two or more hierarchies (like Time dimension), then you should refer dimension name and hierarchy name. For example, a reference to Time dimension Weekly hierarchy is
[Time.Weekly]. In Time dimension primary hierarchy (year, quarter, month day) does not have a specific name, and you can refer to it by mentioning just a dimension name[Time].
Each dimension typically will have a default All member which can be used to get totals of measures by this dimension. If Customers dimension has a default All member named All Customers, then you can reference it with by its name [Customers].[All Customers] or [Customers].CurrentHierarchy.DefaultMember to get the same result. In Measures, all measures are at the top level, and you can reference them with as [Measures].[Store Sales], [Measures].[Store Cost] etc.
How to define a new calculated member
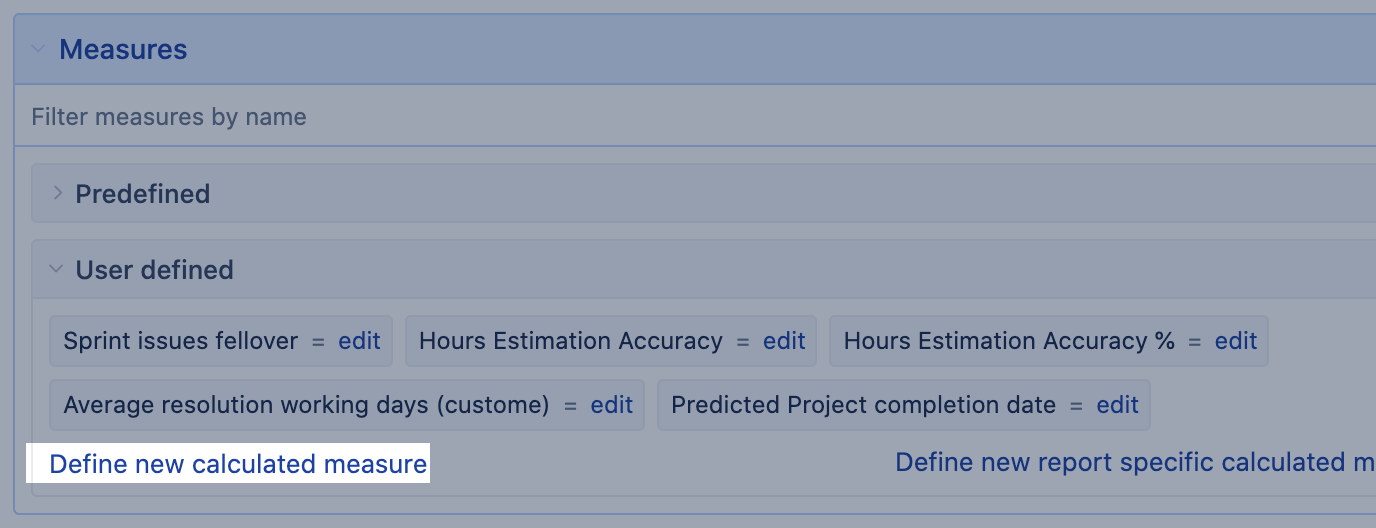
If you would like to define a new calculated measure then expand Measures → User defined section and chose to define new calculated measure.
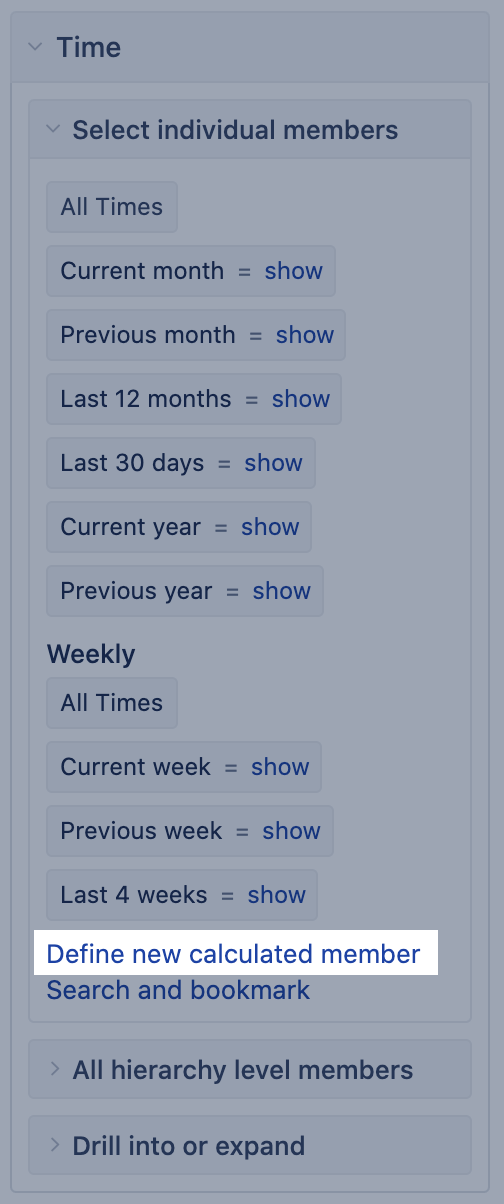
If you would like to define a new calculated member then expand the corresponding dimension (e.g. Time) → Select the individual members section and chose to define new calculated member.
If you would like to edit (or delete) an existing calculated measure or member then click on the edit link. If you do not have the rights to edit calculated members in the current account then you will see just the show link which will allow you to open the calculation of an existing calculated member and see the formula. flex.bi will open a separate screen Calculated member formula for showing, editing or defining a calculated measure or member.
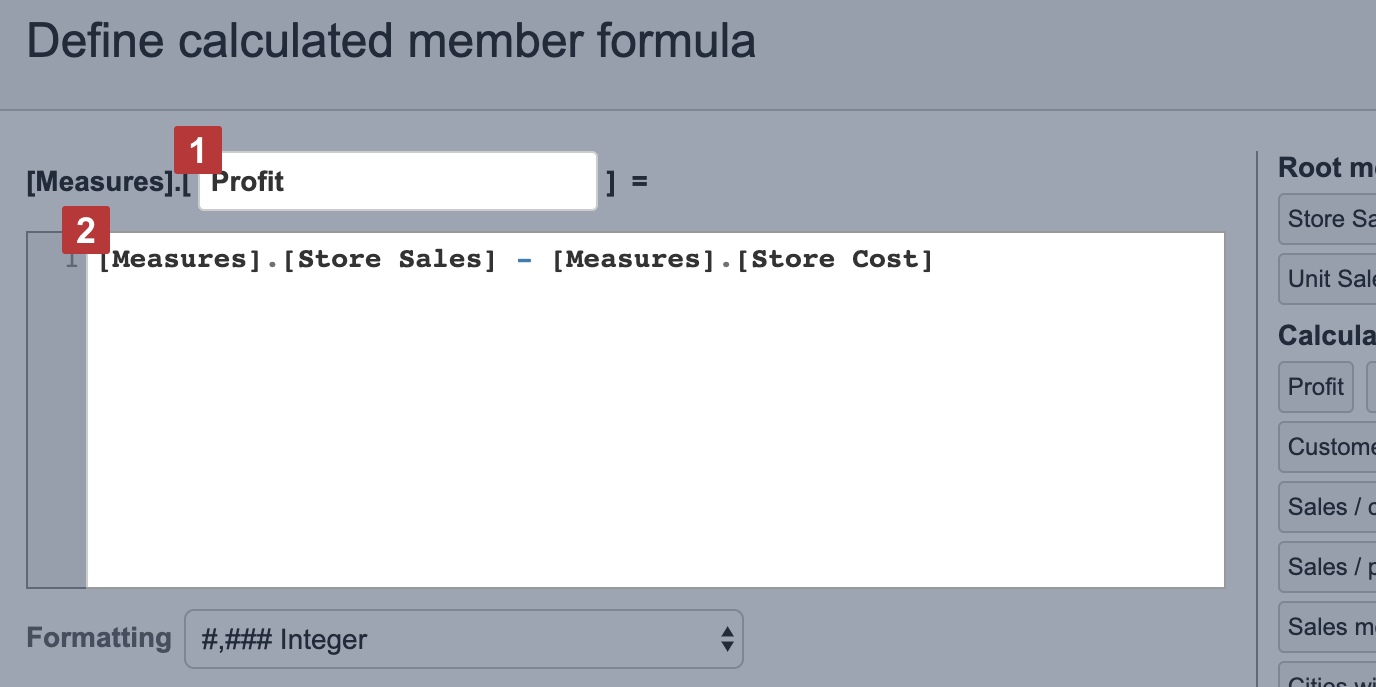
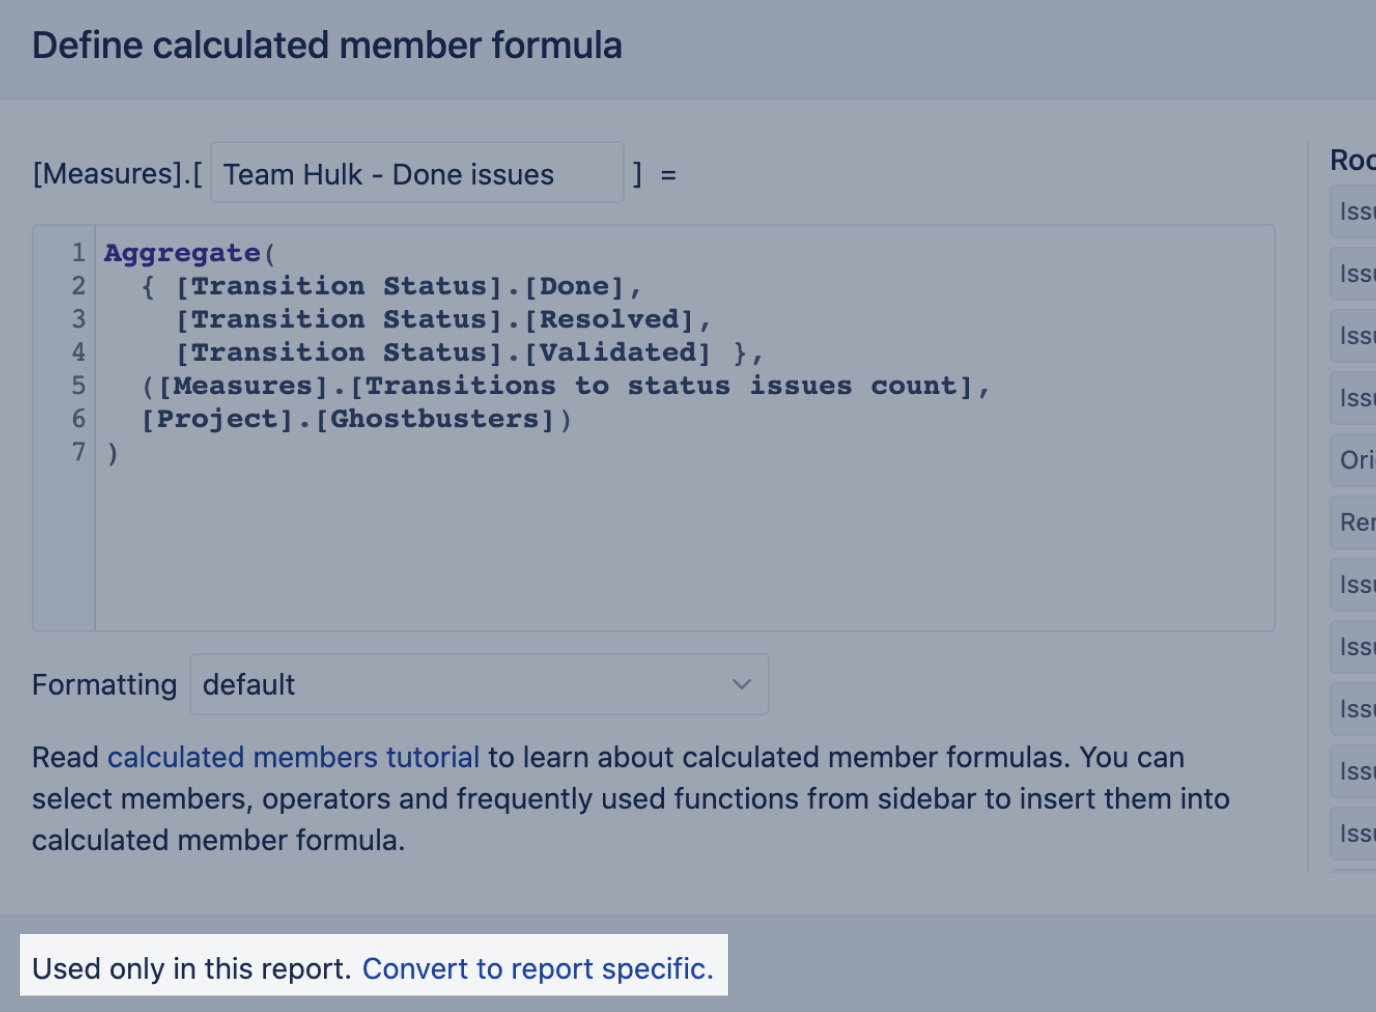
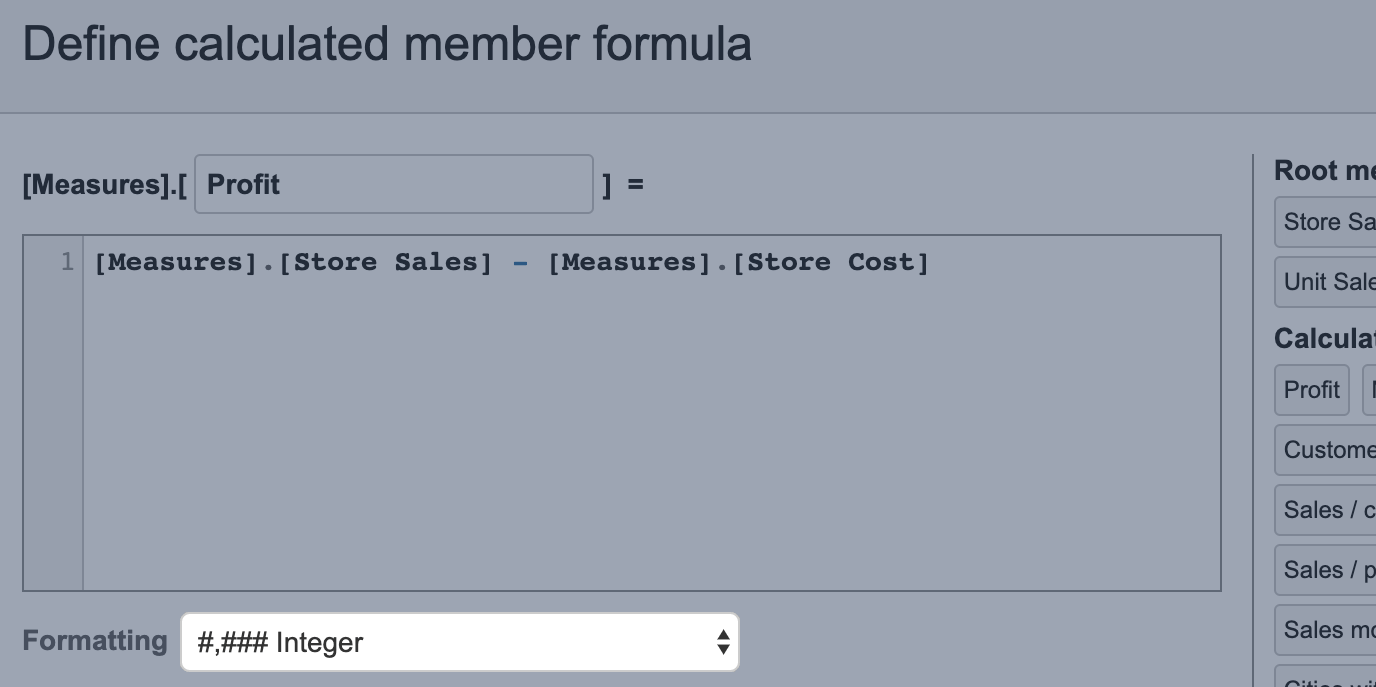
Each calculated member should have a name [1] (unique within the dimension and without any special characters like "&" etc.) and a calculation formula [2] (the rest of the tutorial will teach how to write calculation formulas). In addition, you can specify how the calculated member value should be formatted (e.g. as an integer, decimal, date, or using default formatting). From the right sidebar, you can quickly select other members, dimensions, operators or functions to insert them in the calculation formula.
After defining a calculated member formula press Update to save it, or Delete to delete an existing calculated member, or Cancel to discard any changes. If a calculated member formula will be invalid then a corresponding error message will be displayed.
Report specific measures
It is possible to create the user-defined measures that will not be visible in the section of all user-defined measures but are present in a specific report only. This option is useful if the measure is not intended for use in any other context than in a specific report. The report specific measures behave the same way as any other user-defined measure, the difference is in the visibility of such measures.
The report specific measures are located in a separate section of the Measures dimension. This section is empty once the user starts designing a new report.
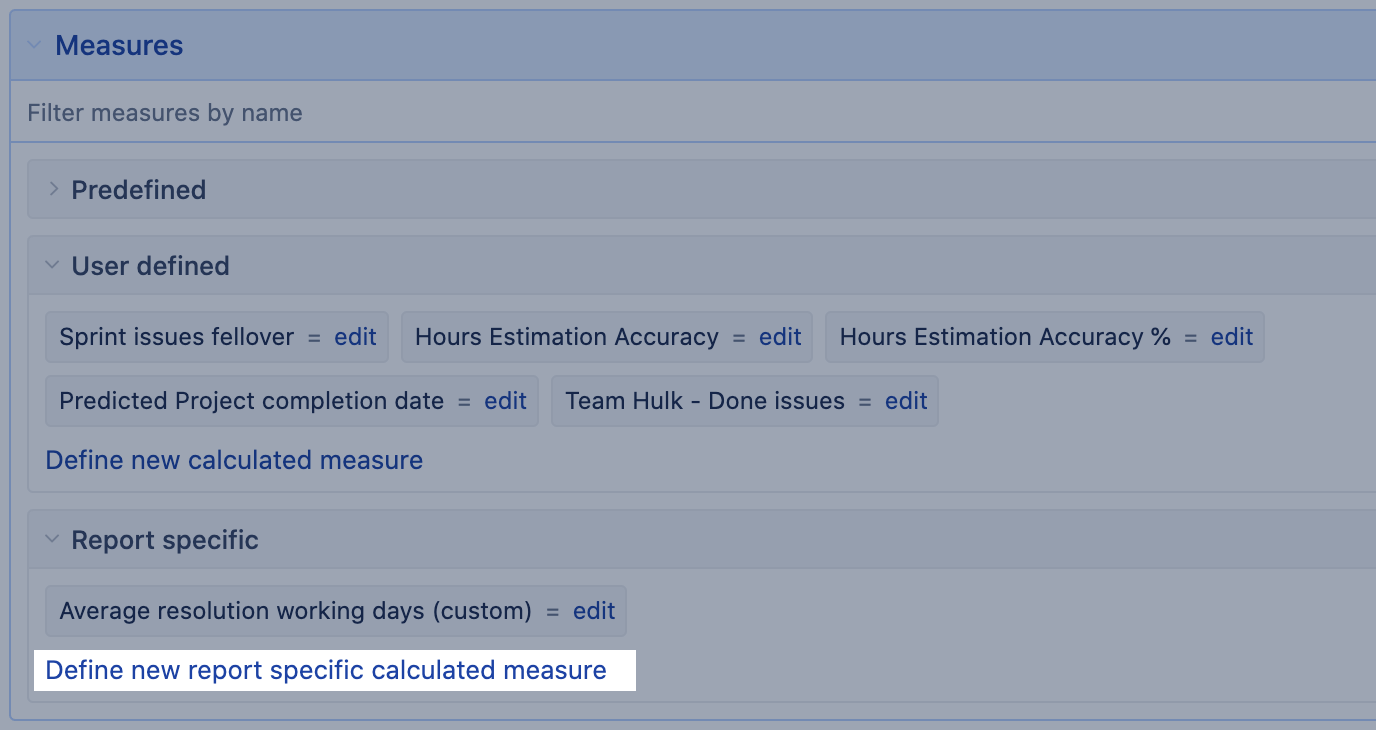
The measure edit dialogue shows the information in how many reports and how many other measures this measure is referenced. There is an option to convert a common (shared) user-defined measure to a report specific measure if the user-defined measure is not used in any report. Once you convert the measure, it is stored together with the report and not visible in the user-defined section.
Member properties
Dimension members have some default properties like .Name and .Key as well as they can have additional custom properties. flex.bi source application import (e.g. from HansaWorld, Tilde or Jira) is also importing additional dimension fields from source systems. Note that a property holds information about a particular member and could be anything that describes that member details.
For example, a User dimension member can be a person (user) and the property of each user can be an address (string), age (number), date of birth (date). In reports, properties are displayed only at a particular user level.
To access and retrieve property values, we recommend using MDX function get(). This function will return property value if a member has such property or an empty result if no property is defined for the current dimension level.
For example, Jira import adds the Invoice date the property for all imported Invoices. The following expression returns the Invoice date property value for the Invoice dimension current member:
[Invoice].CurrentMember.get('Invoice date')
To get a list of all available properties and their values for each member, you may use MDX function AllProperties.
Default values
Sometimes you might want to return a default value if some measure or function will return an empty value. In these cases, you can use a function CoalesceEmpty(), for example:
-- returns zero if no value for store sales
CoalesceEmpty([Measures].[Store Sales], 0)
-- returns default text if user has no such property as Email
CoalesceEmpty([User].CurrentMember.get('Email'),"no public email available")
How to work with the formula editor
Function and member library
Formula editor has a library of MDX functions and available measures and members. When you start writing a calculation, flex.bi provides you an autocomplete list of functions or measures and members.
To get a list of available dimensions and Measures, start typing name with square brackets [ (refresh your knowledge on naming conventions). To get a list of available MDX functions, start typing a function name or entre dot . after a member or another function. Formula editor will show you only those MDX function which could be used in the current syntax.
Comments
It is possible to write comments in calculation formulas. Use comments either to describe some non-obvious complex calculations or also commenting is valuable during debugging of the calculation formulas. When something is not working as expected then comment all formula lines and leave uncommented just some part of the formula that you would like to debug. You may also mark an area of formula and use shortcut ⌘ / to comment it.
-- one line comment

expression -- comment until end of line

/* multi
  line
  comment */
Special comments with annotations
-- annotations.group=...
Put the calculated member in the specified group in the Calculated member's section of the dimension in the report builder.
-- annotations.disable_drill_into=true
Do not allow the Drill into action for this calculated member.
-- annotations.disable_drill_across=true
Do not allow the Drill across action for this calculated member.
-- annotations.disable_drill_through=true
Do not allow the Drill-through action for this calculated member.
-- annotations.disable_drill=true
Disable all drill actions for this calculated member.
-- annotations.total=sum
Force the total calculation as a sum of row calculations when the total for rows is selected from toolbars
-- annotations.drill_through_non_empty=false
During drill through issue the calculation will be executed over all issues imported in the account ignoring any report context. It could slow down the drill through issues output significantly!
-- annotations.copy_as_user_defined=true
Enable the option to edit template measures in the recipient account. Changes made in those measures won't be overwritten during data imports.
Formatting
When creating a new calculated measure you can choose the format for the output of results.
If not selected, flex.bi would return a default format which sometimes is not correctly identified by flex.bi (for example, if calculation is the result of DateDiffDays() function)
You can choose between the following formats:
|
Formatting |
Comment |
|---|---|
|
Numeric |
|
|
Percentage |
|
|
Date / Time |
|
|
Duration |
|
|
Size |
|
|
Text |
flex.bi uses Font Awesome icons and it is possible to refer to them in a calculated measure when using markdown formatting, e.g. See some examples here: https://flex.bi/bi/accounts/47/dashboards/1731-conditional-messages |
|
NEW Sparkline |
|
|
Custom |
With this, you can change the result representation to another, e.g., For more details (and string templates) see how to Format string content. |
Shortcuts
You can use the following keyboard shortcuts in the formula editor:
-
Cmd Return (⌘⏎) — save or update the calculated member.
-
Cmd Shift M (⌘⇧M) — maximize/minimize the formula editor dialog.
-
Cmd / (⌘/) — comment or uncomment selected lines.
Training video on calculated measures and members