flex.bi product overview
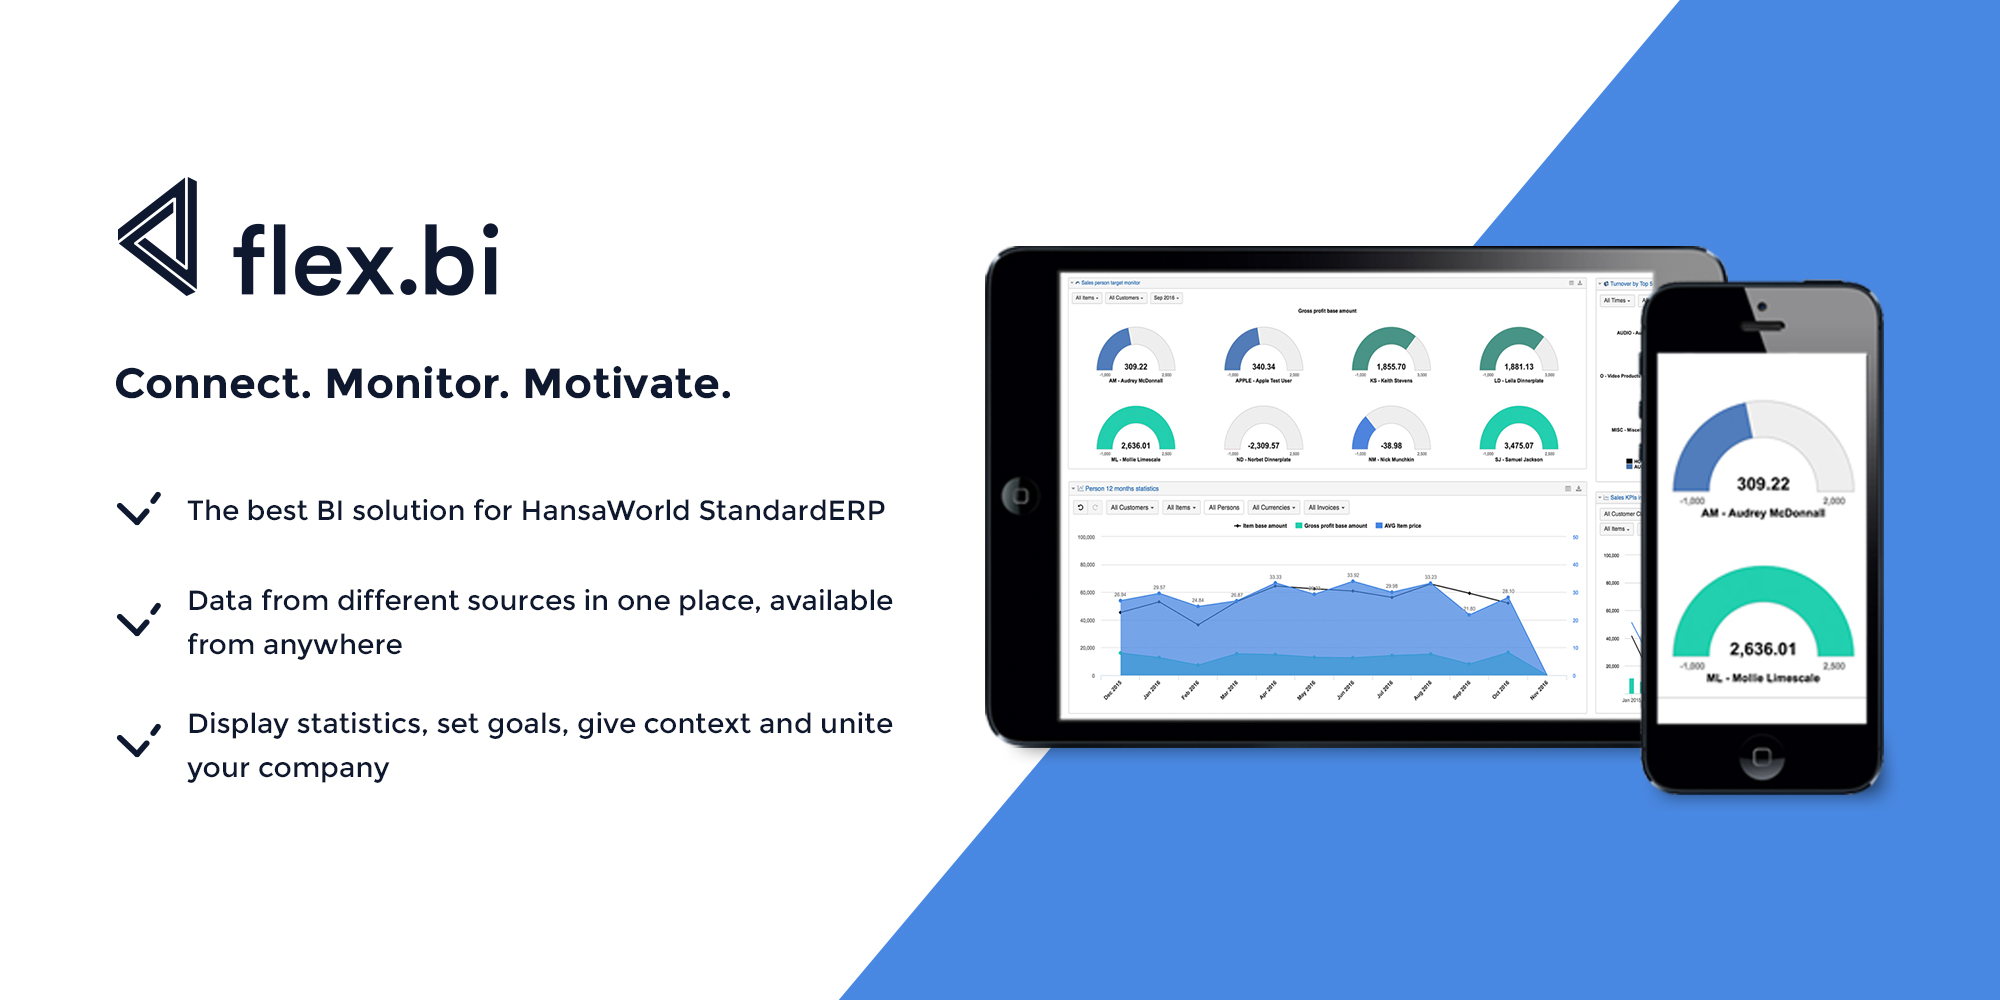
What is flex.bi?
flex.bi is a web-based BI platform that makes creating business Dashboards as easy as possible - easily to prepare, analyze and explore growing data from multiple sources.
You can gather all your company data in one place, save time on manual data management, make decisions faster and motivate your team to reach targets in a more effective way. flex.bi can be used to monitor overall company progress as well as for quick spotting of discrepancies and errors. You can use flex.bi for retrospective analysis of previous experience, for up-to-date actual data monitoring and for future predictions about each and every KPI that matters for your company.
Product versions
flex.bi is available in two versions - Cloud and Enterprise.
Cloud version is taken care of by flex.bi. You can create an account, choose the most appropriate plan, connect to the data source and start using it in a matter of hours. It has all the features and flexibility but has its limits and might not be suited in case of specific requirements and customization needs or extra large amount of data.
Enterprise is your private server installation that can be hosted in the cloud by us or on-premise with your security requirements. It can be customized for your special needs: new data source integrations, support for specific business processes, or data structures.
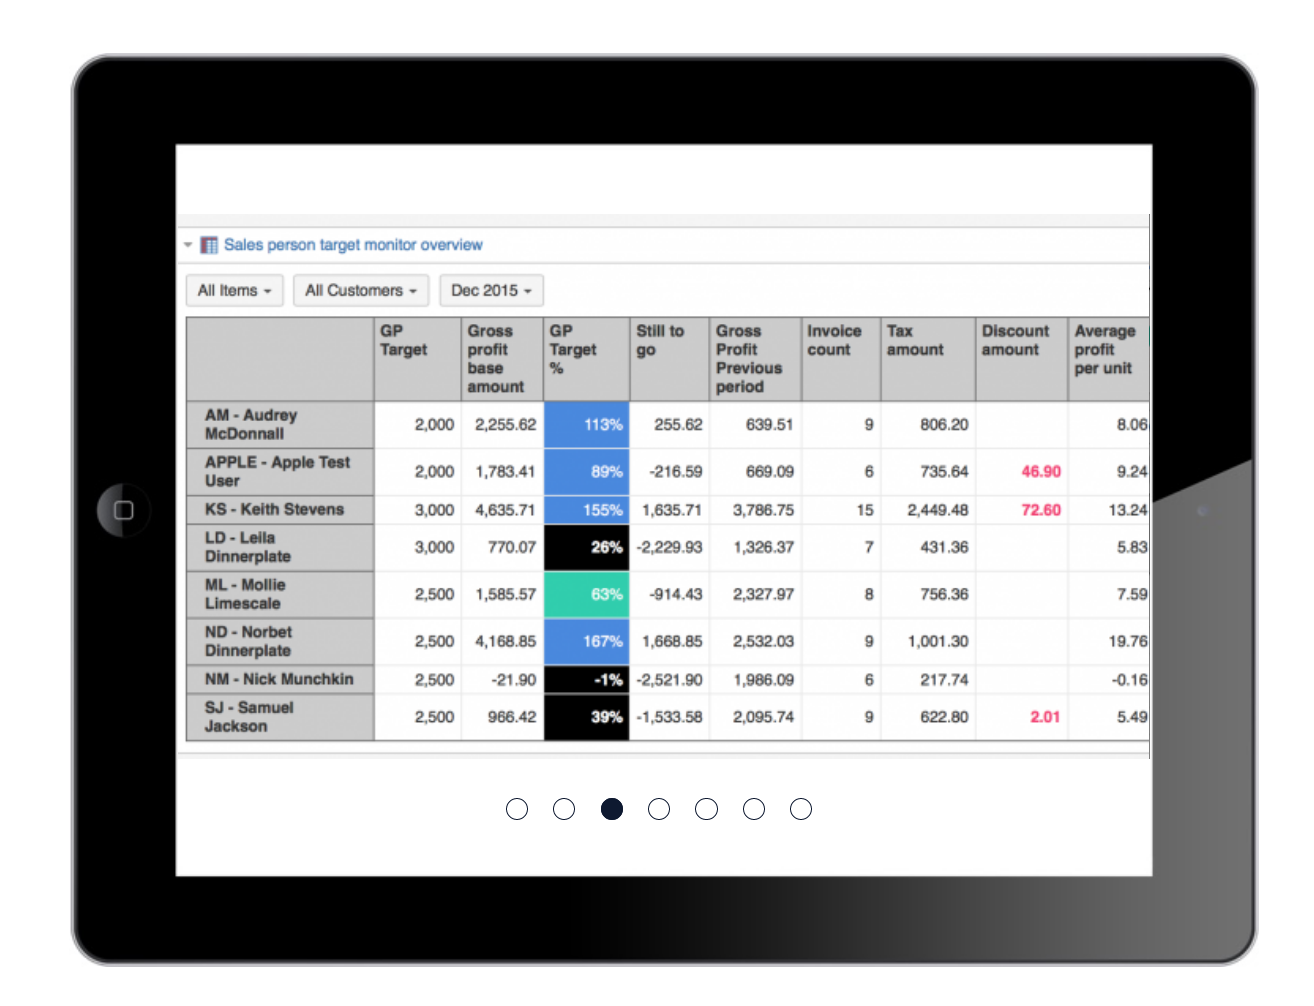
Dynamic and flexible reports
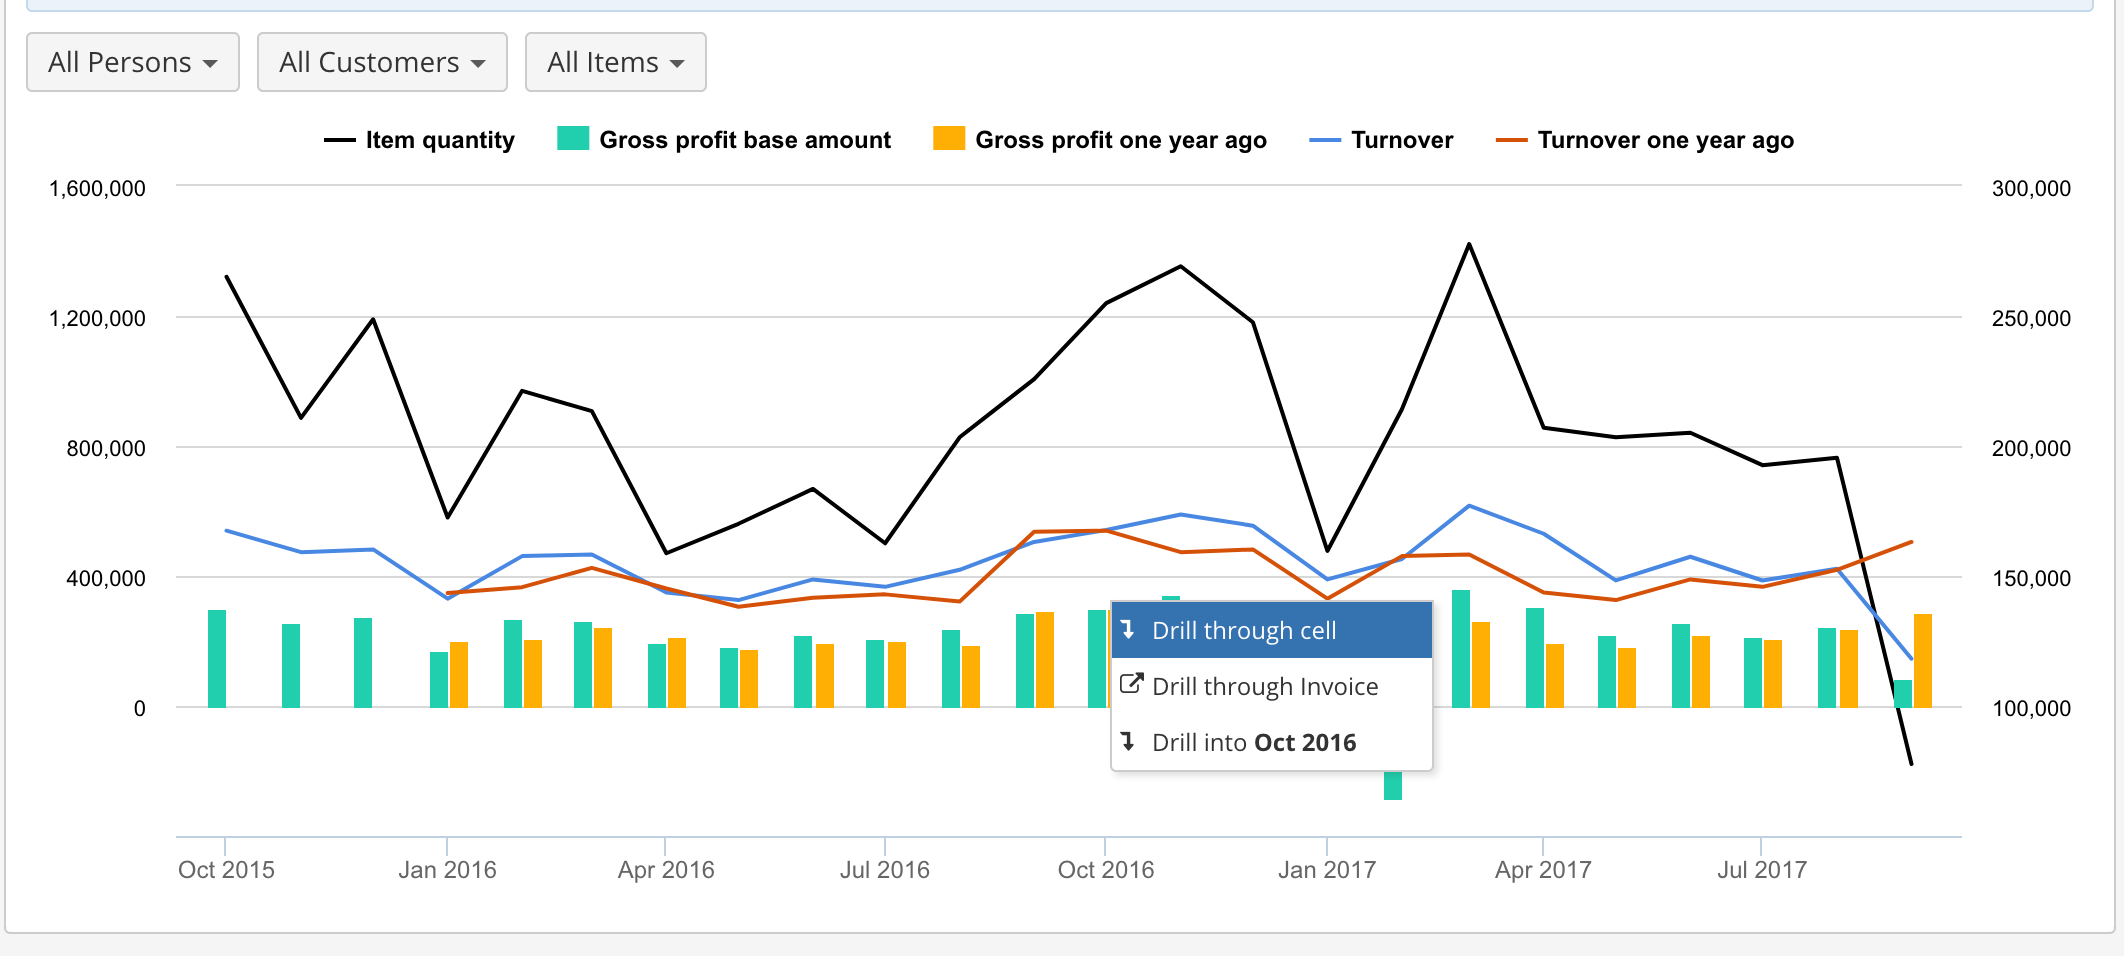
With flex.bi you can build and customize reports with simple Drag & Drop, use 4 types of Drill options, to see related data, and display the results in 8 different chart types - bar, line, pie, scatter and others. Share results in scheduled emails, exported to XLS or put your Dashboards on the wall as a Wallboard. Calculations in MDX give you the freedom to implement more complex formulas for data selection.
|
|
|
|
Report Templates library
To make things easier flex.bi offers collection of Dashboard and Report Templates. You can choose the right reports depending on your data, industry, company profile and goal you are trying to reach and transfer to your Cloud or Enterprise account with your date in a couple of minutes. Templates are easy to adjust to your data and needs. If you decide to be a power user - you have full capability of the Drag-and-Drop report building environment to create your own solutions and implement more complex algorithms.
Some of the most popular templates:
- Sales analytics - Your sales team performance overview in detail. Top Items, top customers and other sales team activity boosters.
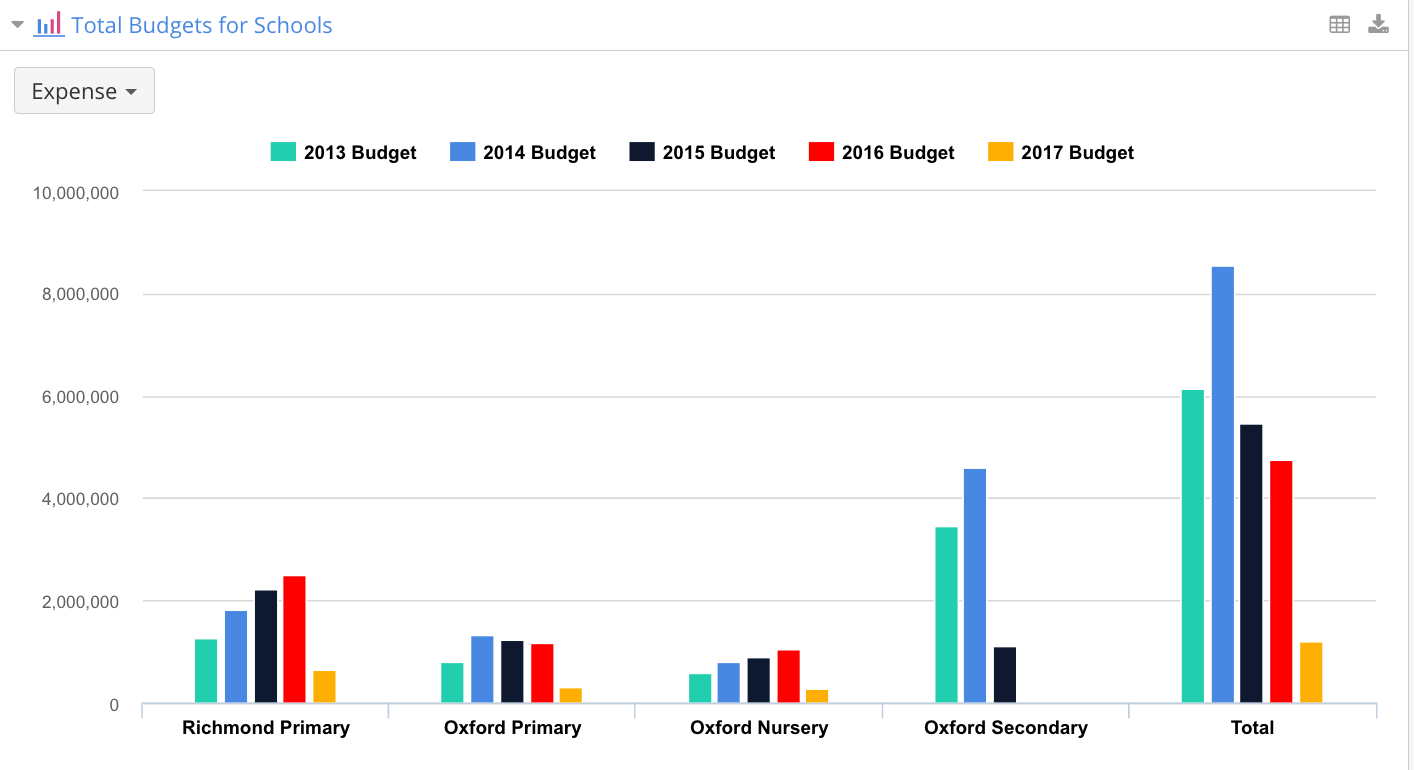
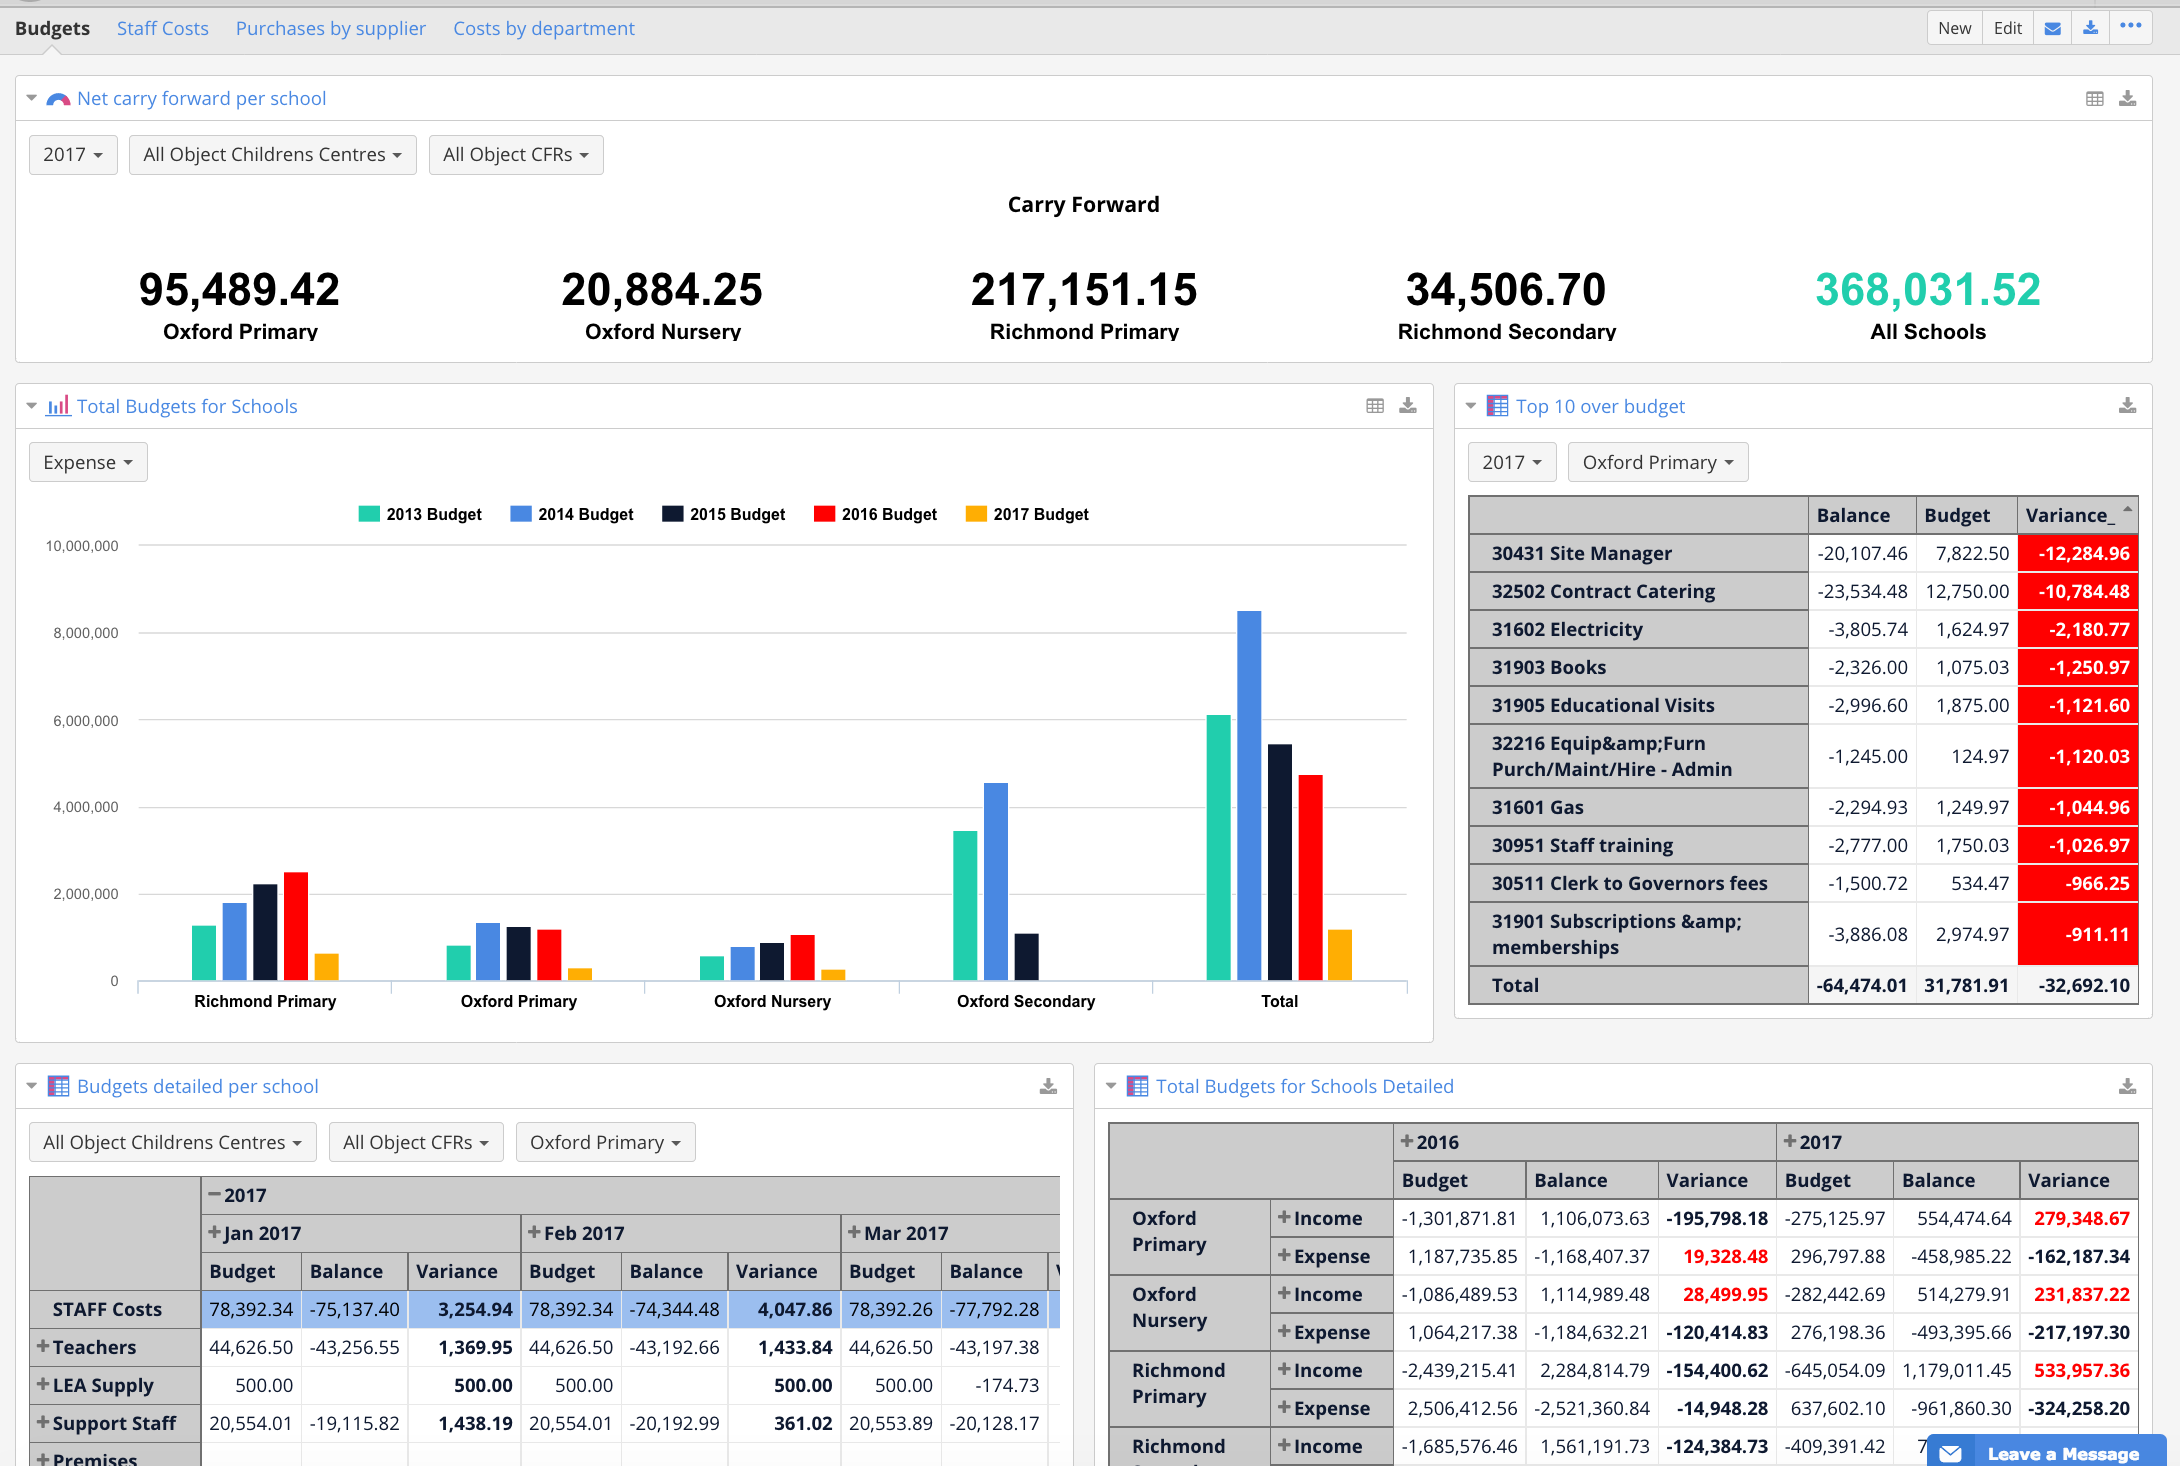
- Budgets and target monitoring - Automated real-time budget control. Add target values on top of your ERP data from Excel or Google spreadsheets. Google Spreadsheets template with detailed budget control options is available.
- Trends and forecasts - Predicting the end of the month results for different departments and calculating trends of the future.
- Product & Customer segmentation - Discovers profitable items and customers worth your attention.
- Team competitions - boost the productivity of your and make reaching goals more fun and engaging
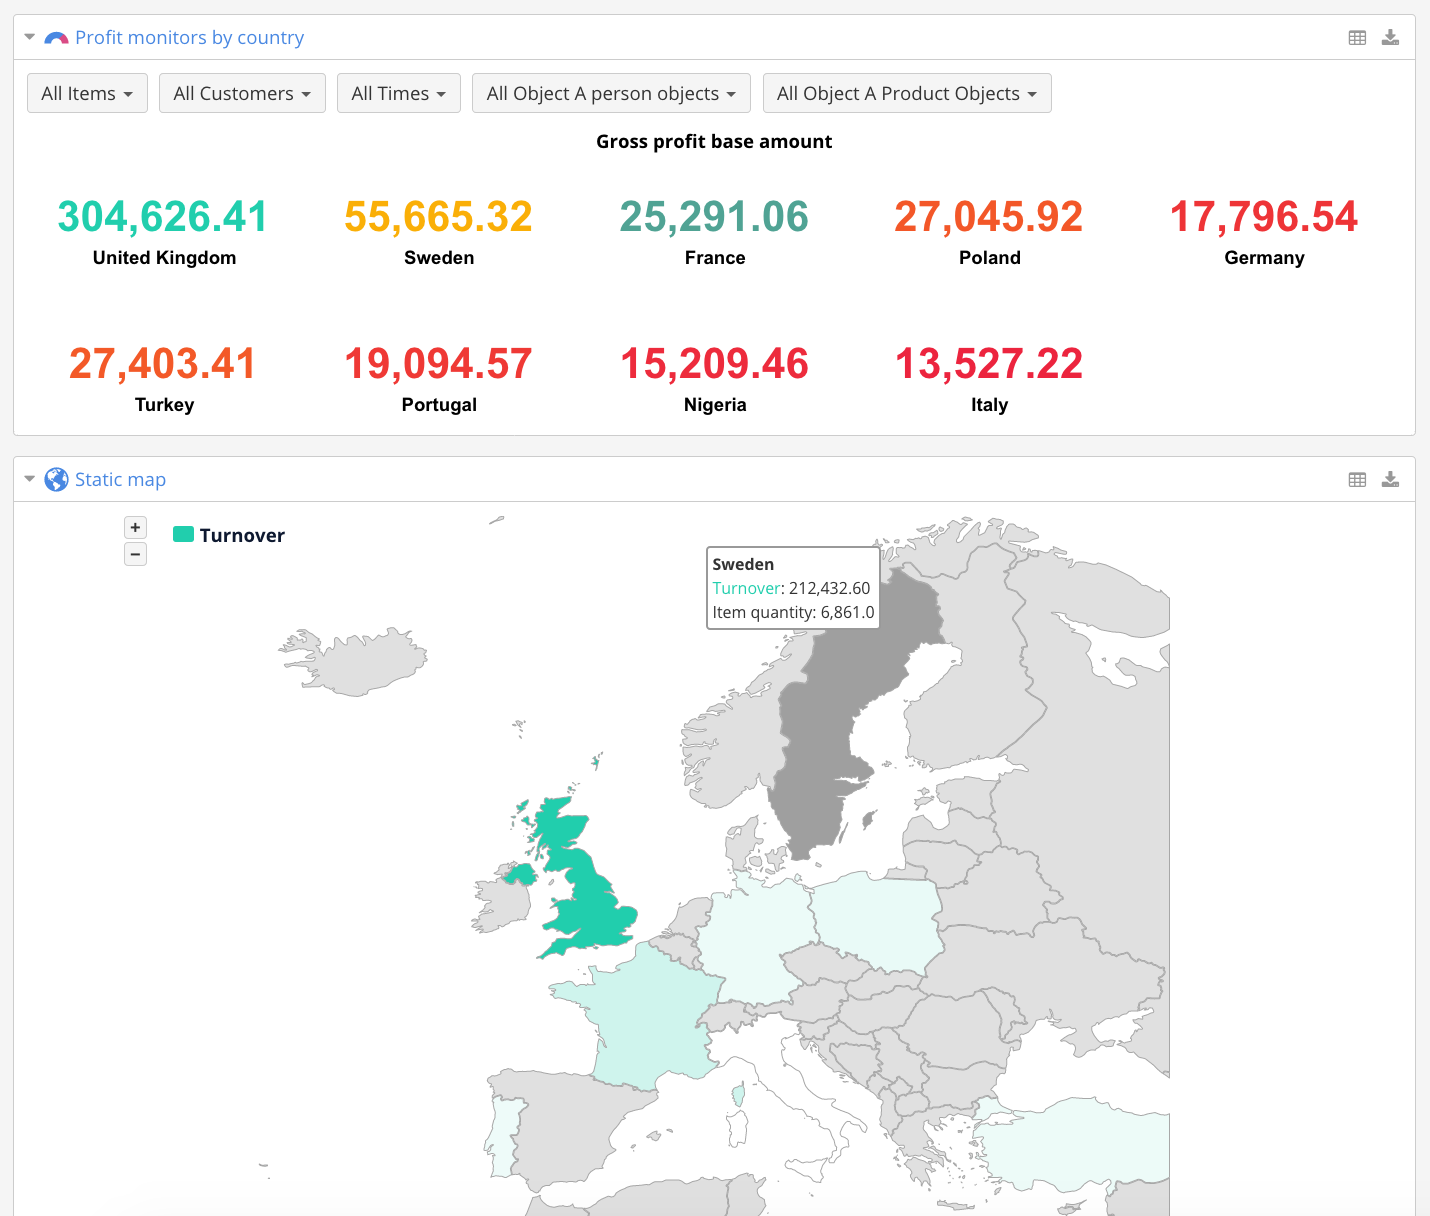
- Map charts - display results on the map and use Geocoding to link customer addresses to longitude and latitude values automatically
Finance consolidation
For multi-company businesses, we offer Finance consolidation. Easy way to have all your business results in one dashboard to see the big picture as well as to monitor each company's performance and discover all your questions in detail.
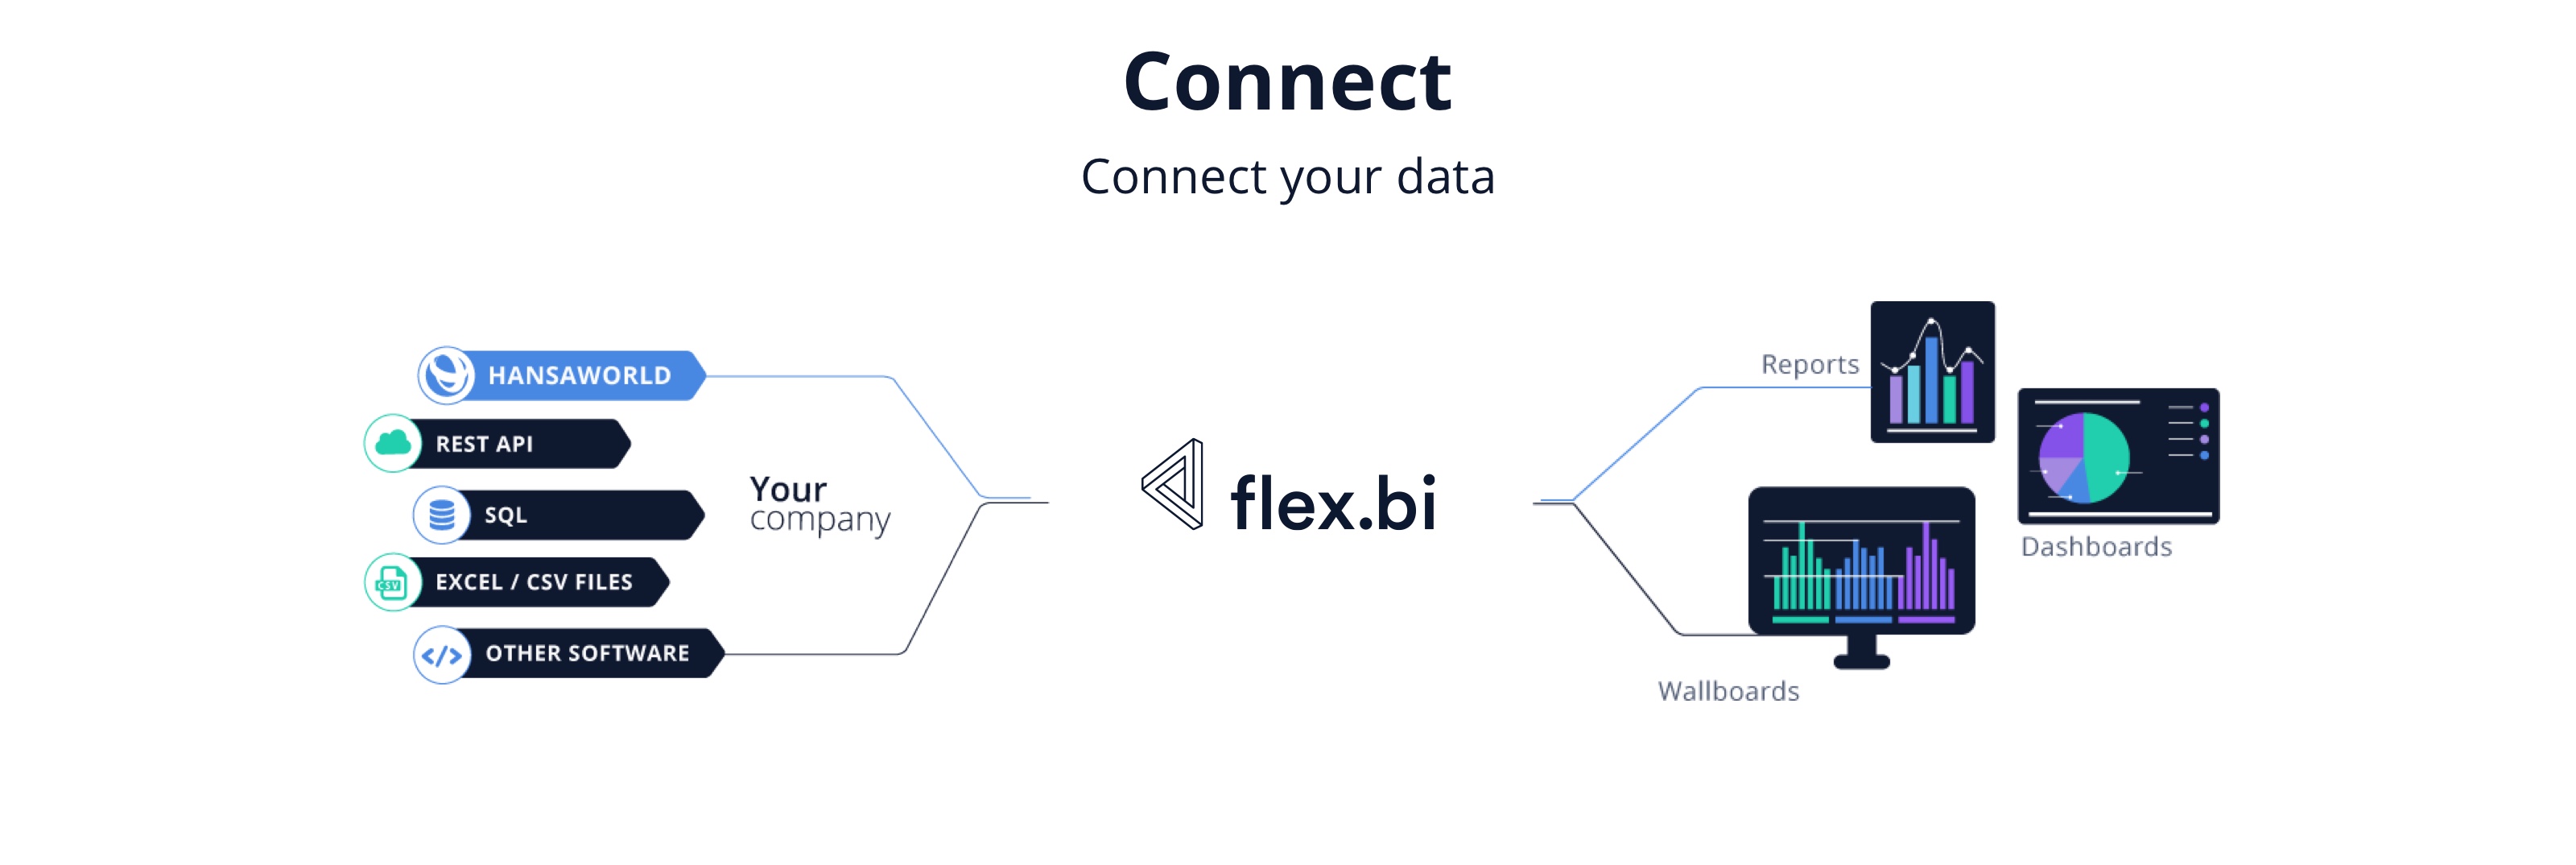
Multi Source BI system
flex.bi specialty is friendly and automated Standard ERP integration, but you also can build multi-source reports with data from other systems. Advanced but friendly applications are available for Rest API and SQL connections as well as for JIRA issue tracking, Zendesk, and other web services. Excel and Google Sheets integration allow you to add budgets, targets, and other important info stored outside any other system and see the whole picture of progress.
Example: To measure the success of the latest marketing campaign, you can compare Sales Ledger from Standard ERP, Google Analytics data and salesman activity from your Asterisk call central. If you would like to see Stock numbers by the route and compare them with Logistics system data and issues created in JIRA issue tracking software, that is also possible.
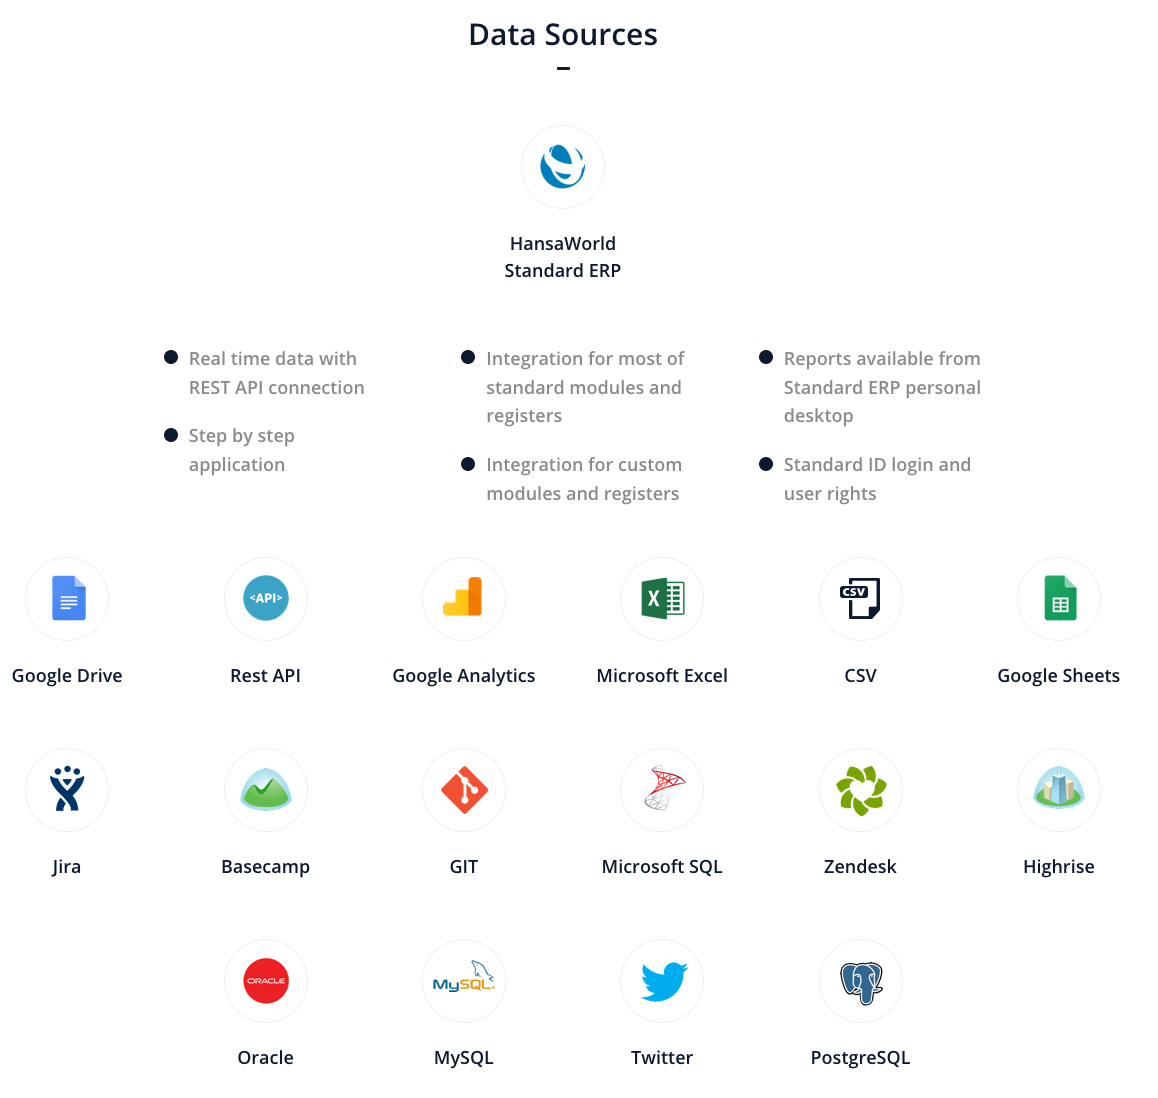
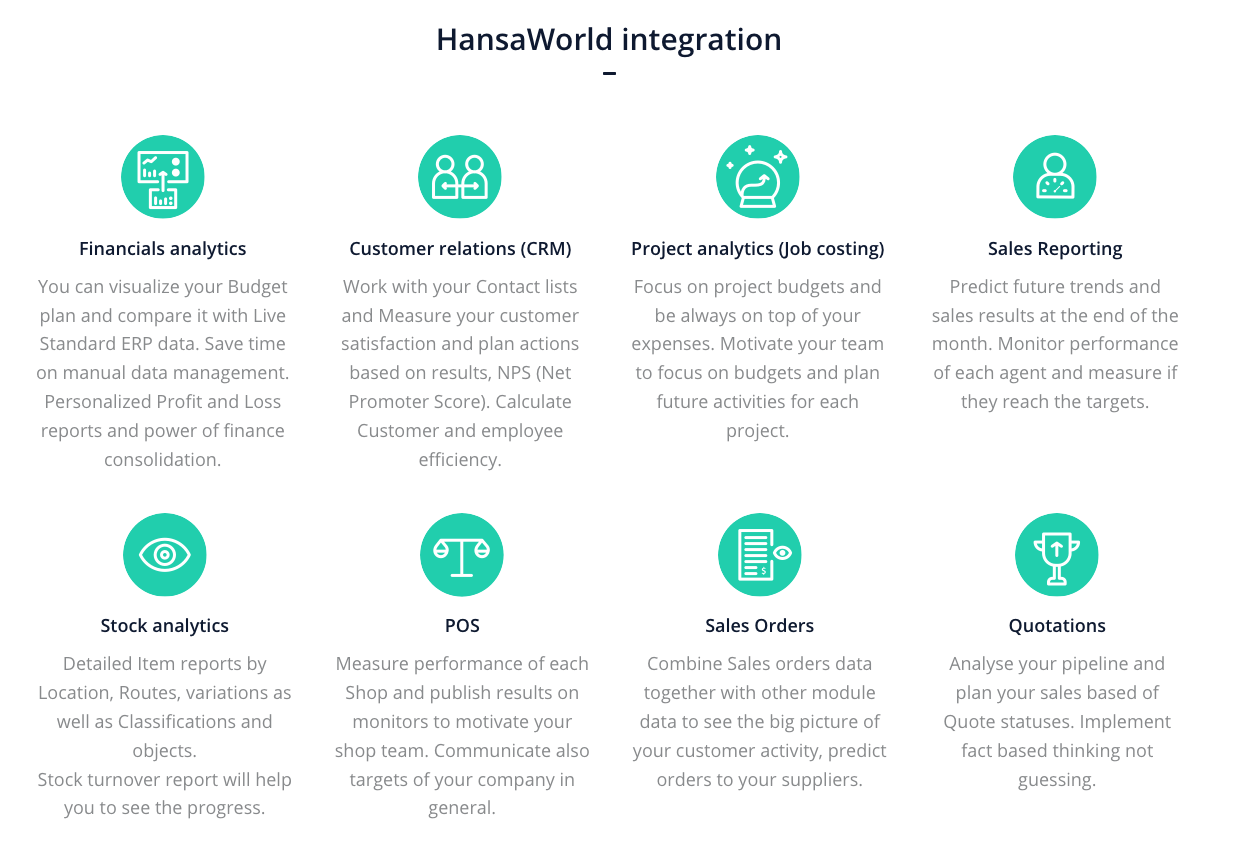
HansaWorld Standard ERP integration
Step by step application allows to connect your Standard ERP to flex.bi with less than 1 hour setup. Data relations and logic will be transferred to flex.bi, allowing you to focus on results in your reports rather that data source.
flex.bi Cloud version supports integration for Standard ERP Modules listed below, but with Enterprise version you can add other modules, registers and develop connectors for other custom software. Report Templates and Sample reports are available for all supported data cubes.
Data connectors for HansaWorld product line
For Standard ERP users, there are 3 data connections available. Import frequency, company selection, extra dimensions and other options can be specified in the application.
- Rest API connection - ensures direct connection with Standard ERP. Requires Standard ERP version 8.1 or later.
- Hansaworld Source files import - controlled by a HAL package of pre-scheduled exports of Hansaworld (.txt) files and Script that imports data.
- Combined method - supports both ways of Hansaworld data connectors. Import type can be defined for each register or setting.
Report publishing
Each person depending on his position in the company and habits can choose a most suitable option for them to access flex.bi reports and dashboards.
- Dashboards in email subscriptions - receive actual numbers in PDF file in pr
- Embed reports - in other software and web pages as an iframe and use access tokens to control user actions allowed.
- Export report results - to Excel, PDF or CSV file
- TV Dashboards - communicate goals and progress on Wallboards around your office, warehouse or production environment.
- Mobile friendly interface allows to use flex.bi on your touchscreen devices when you are out of the office.

User rights & data access roles
flex.bi distributes data by accounts, and one flex.bi account contains a set of data which can be analyzed by one or many account users. The user who creates the flex.bi account is the Owner of the account. The owner has all rights for this account and also can add additional users to the account. When a user is added to the account, it has access to the data in the account that determined by their user role. Only system administrators have access to the system administration pages where system configuration options can be modified.
Data access roles are great for company owners to limit data that can be accessed by regular users, ensuring that users see only the data relevant to them. For example, warehouse operatives shall have an overview of Stock dashboards only or project managers shall have an overview of reports to which the particular project manager is assign to. Data access roles are available in Users section for Business and Enterprise plans.
You can limit access by:
- single report or folder in Analyze tab
- dashboard in the Dashboards tab
- data cubes (Financials, CRM, Sales, etc.)
- dimension members (object, classification, person etc.)
Full documentation about Data access roles and how to set them up can be accessed here.
Speed
Data is alive and changes. For us delivering real time answers in minimum time is a priority. We use the help of good quality data connectors and OLAP cube to ensure that. The database stores all the possible combinations of answers that are calculated during the import. It allows you to access data fast.
Security, technology, and server maintenance
- flex.bi is built with the Ruby on Rails framework which includes standard countermeasures for common web application security threats, such as cross-site scripting and the framework also ensures session security , it is also recommended to use HTTPS / SSL in production to ensure those session cookies are sent via a secure connection.
- Each flex.bi web requests is authenticated and authorized ensuring that each user can only gain access to the accounts where they have permission. User can also only access the application via web requests and have no access to the source code on the server.
- We use https://www.hackerone.com/ services where several invited hackers are testing and reporting security vulnerabilities.
- To monitor user activity and report speed we have created Usage statistics Dashboard that allows each system administrator to track errors and changes on their server.
- All of the main activities, web requests and background import jobs are stored in the log files. Log files are stored on the server and can be accessed through the application in read-only mode.
Server requirements
Software
- flex.bi Enterprise installation that is supported on Mac OS X, Linux and Windows.
- Java SE 7 or Java SE 8 should be installed.
- MySQL (version 5.x), PostgreSQL (version 9.x), MS SQL (version 2008 or later) and Oracle (version 11g or later) are supported as a private flex.bi database.
Hardware
It is important to have enough RAM on the server to cater for the needs both of flex.bi server (the java process) as well as MySQL or other SQL caching needs. For larger setups minimal suggested would be 2GB RAM for the java process and 4GB for the MySQL process.
To leverage the feature of parallel import threads to improve import speeds it is important to have as fast as possible and as multiple CPU cores. For larger installations, we are suggesting AWS configuration c4.2xlarge with 8 CPU cores that allow to safely import data with 5 or 6 import threads in parallel.
Customer Stories
| " flex.bi on-line "Sales interactive screen" allows us to follow team results continuously and helps to accelerate decision making and implement improvements needed. It is the perfect tool to motivate the team to get better results and reach the targets." Vilnis Krauze, CEO Baltu Veterinārija LTD, http://www.baltuvet.lv/, Latvia |
| "The drag and drop interface makes it easy to understand and create complex reports in minutes.The cube structure to data allows one quick access to large data sets. Alan Harper, CFO, https://www.digicape.co.za/, South Africa |
| “flex.bi is is the best BI tool if not the only to perfectly have your data from HansaWorld SERP in one view. When you understand how to use it, the possibilities are unlimited. The drill down functionality is wonderful. With the different type of charts it makes reporting and planning easy. I started to use flex.bi in 2014 with only 5 registers from HansaWorld that were supported. Today flex.bi supports all the major Registers within HansaWorld SERP which shows that their team is committed to provide a proper Business Intelligence tool for HansaWorld SERP users. I just signed to use Enterprise plan.” Norman Mouton, Group Management Information Systems Manager, http://www.deepcatch.com.na, Namibia |
.png?inst-v=cd5dbfef-173d-45af-9e4c-a76f7bb3b94c)


 | 
 |  |


Company Details
Flex BI SIA
LV40203021416, Baznicas 5, Riga, Latvia
Reg. Nr.: LV40203021416
flex.bi support: support@flex.bi, flex.bi sales: sales@flex.bi
![]()