Use conditional cell formatting in tables and Gantt charts to highlight individual cells, columns, or rows.
Overview
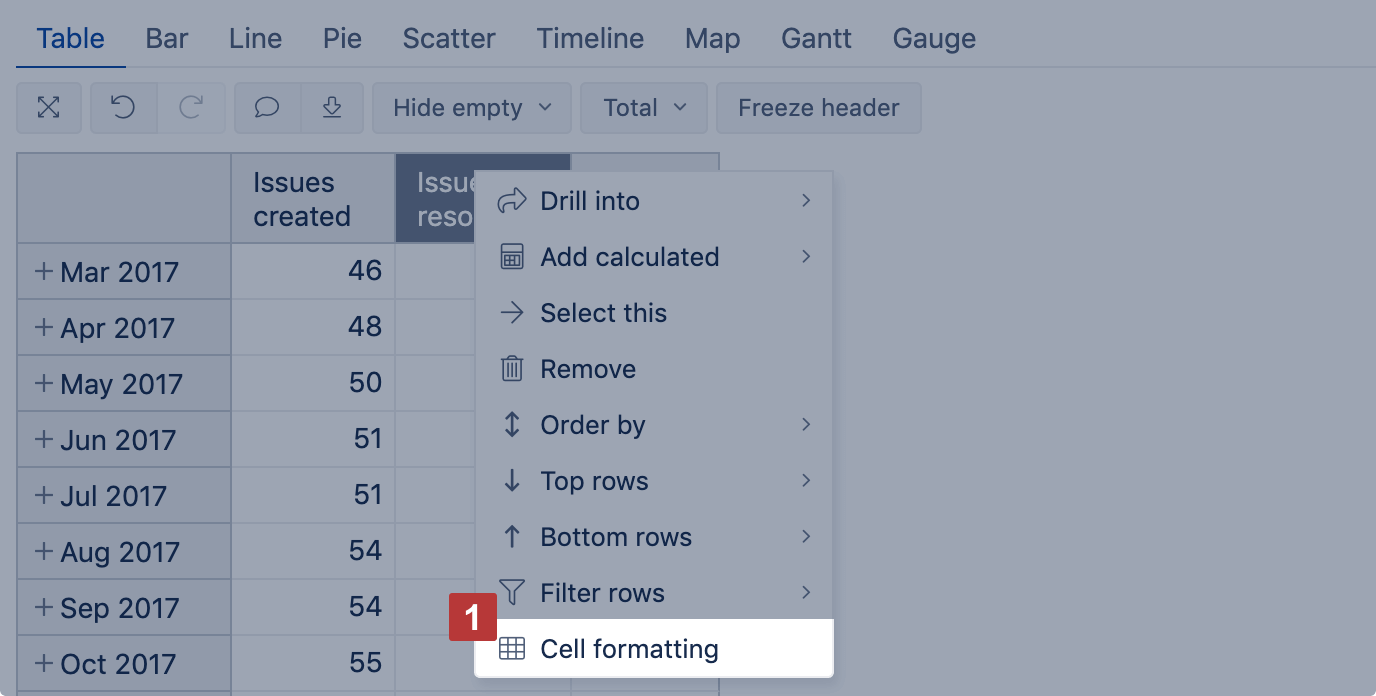
Select Cell formatting [1] from the column or row header, the table options.
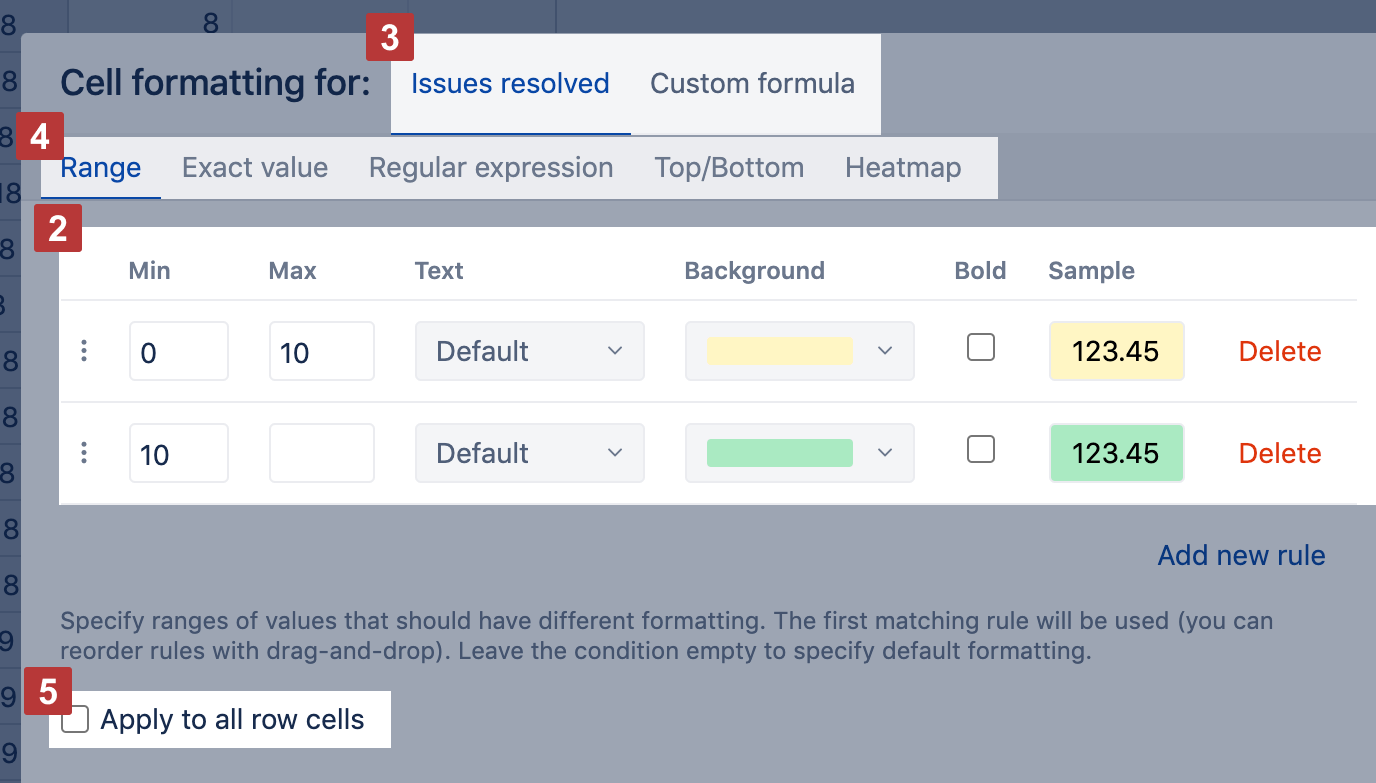
Specify one or several rules [2] to detect cells that should have different text or background color, or use a bold font in the column or row. You can set one or multiple rules, the first matching rule will be used.
There are two ways how to apply those rules [3]: you can set them on the values displayed in the cells or on the value calculated by a custom formula. Also, there are several ways to define conditions [4]: Range, Exact value, Regular expression, Top/Bottom, and Heatmap. Select one of them.
Use the option Apply to all row cells [5] to apply color/background/font style to all cells in a particular row. If some other column in the report also has formatting, then conditions are merged in cells in this column (formatting from another column is applied if text, background, or font in this column has a default selection).
Range
Specify ranges of values that should have different formatting. Can be used for numeric values, percentages, intervals, or dates. Both min and max end-point values are included in the range.
For dates, use exact dates or relative dates to define a range. If the date is a DateTime value (also has a precise time, e.g. Issue creation date, Issue resolution date), the start of this date (00:00) is always used, take it into account when defining Max value (add one more day).
For percentage values, include % sign (e.g. 10%).
Example
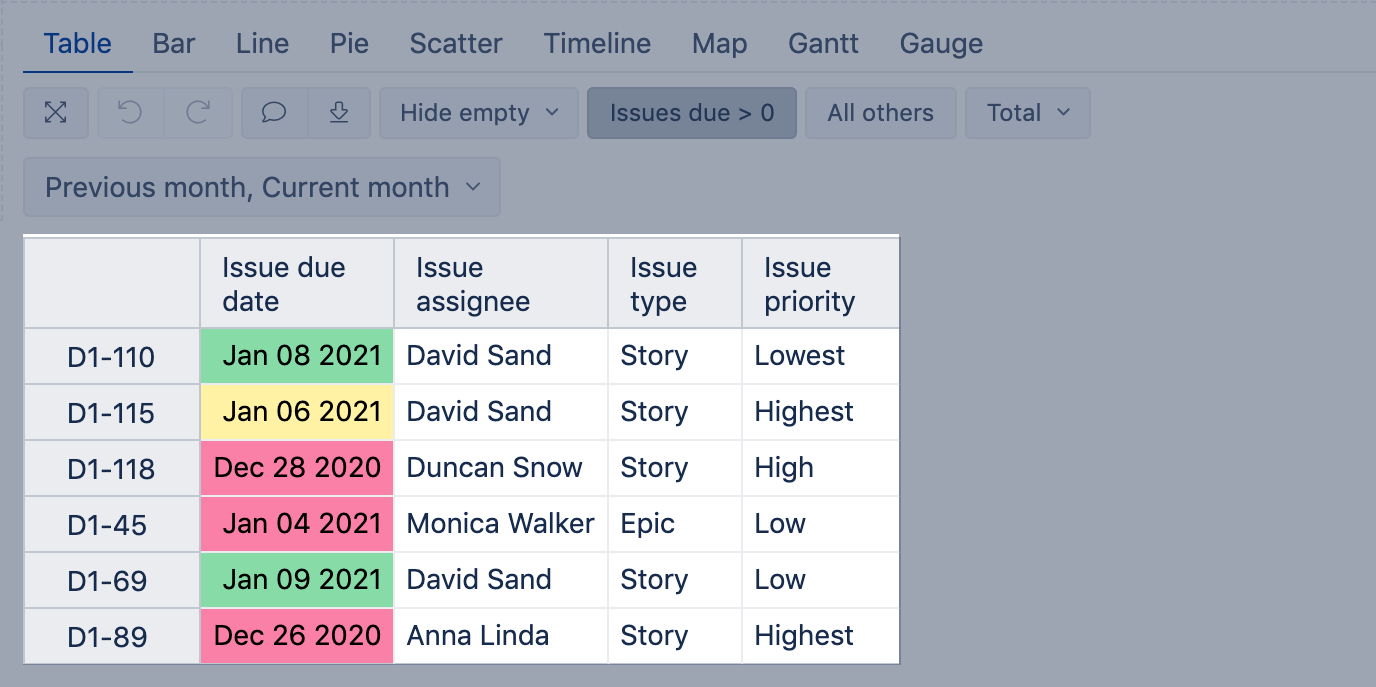
Using relative dates, color-code cells based on issue due date: overdue, due today, and due in future.
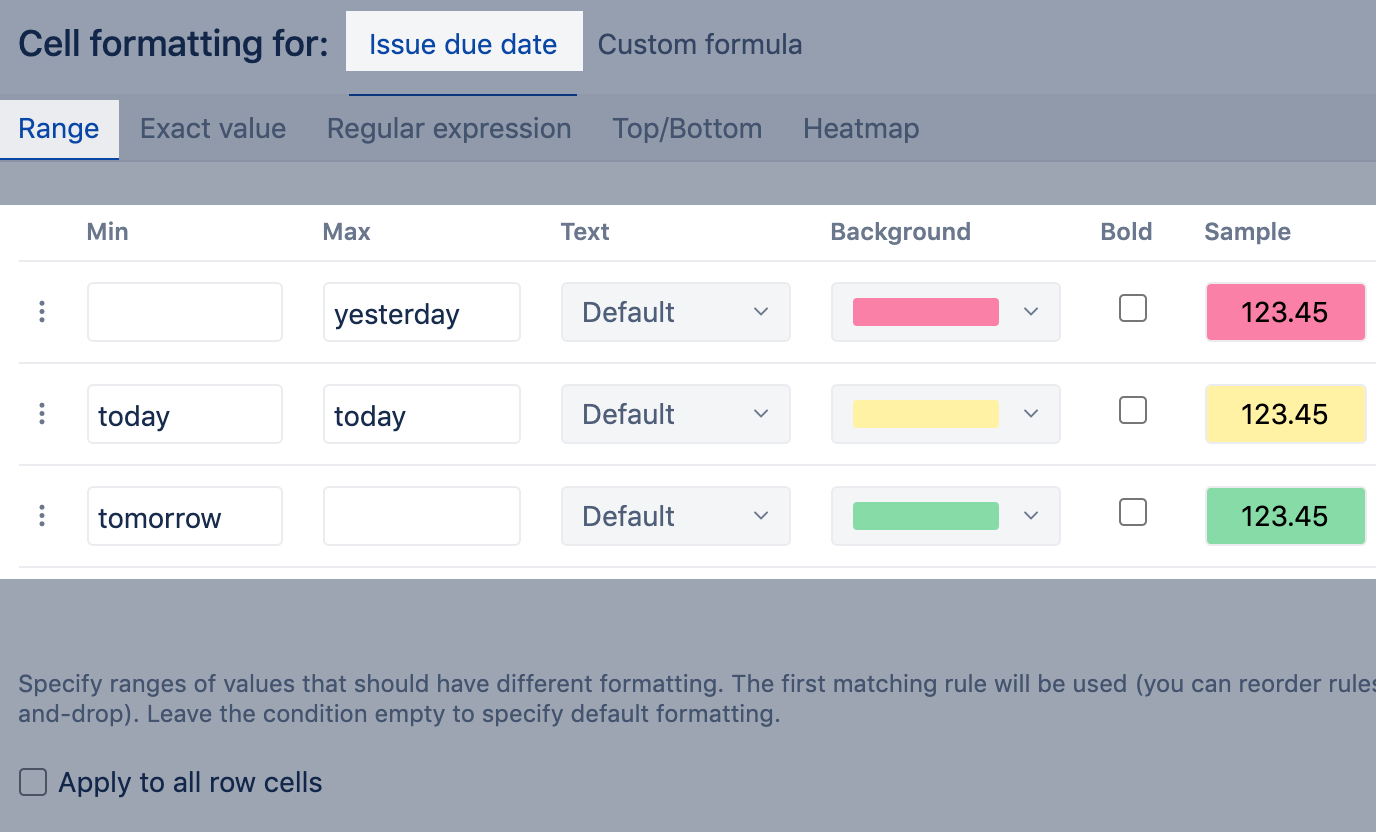
Note for DateTime values. Use the next day for Max value: "today" instead of "yesterday", and range "today" - "tomorrow" instead of "today" - "today".
Report with applied rules (the report was run on Jan 06, 2021):
Exact value
Use exact value to apply rules for text or integer numerical values. This approach is recommended if you have a few specific or unique values (e.g., statuses for texts, story points for numbers) and you want to color-code cells by them. Use precise and case sensitive value. Select the Empty checkbox to highlight cells with empty values.
Example
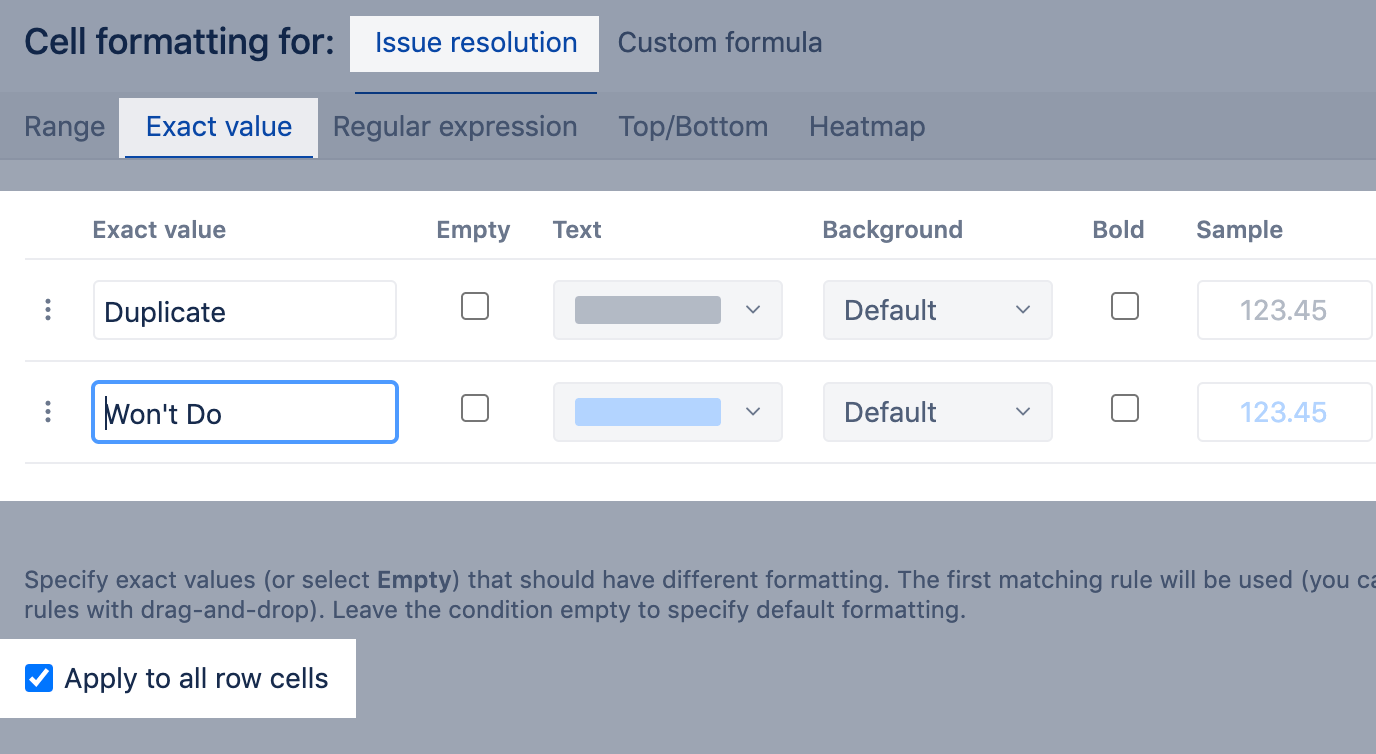
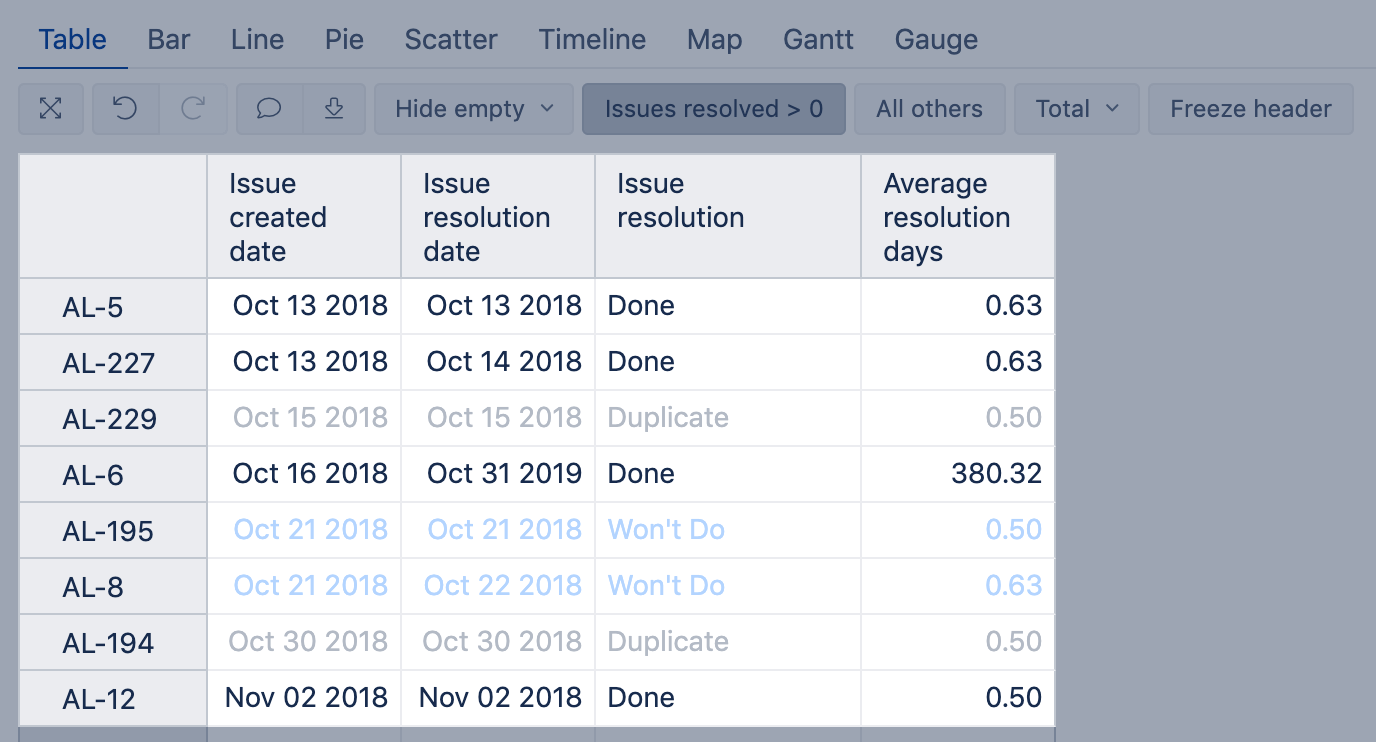
Using exact value condition, color lighter the text in all cells for issues with resolutions Duplicate or Won't Do.
Report with applied rules:
Regular expression
Use regular expression to apply rules for text containing some pattern (e.g., starts, ends, or contains specific characters). Use Regular expressions to define the pattern. When used for date values then the date text representation (using the measure date formatting) will be used.
Example
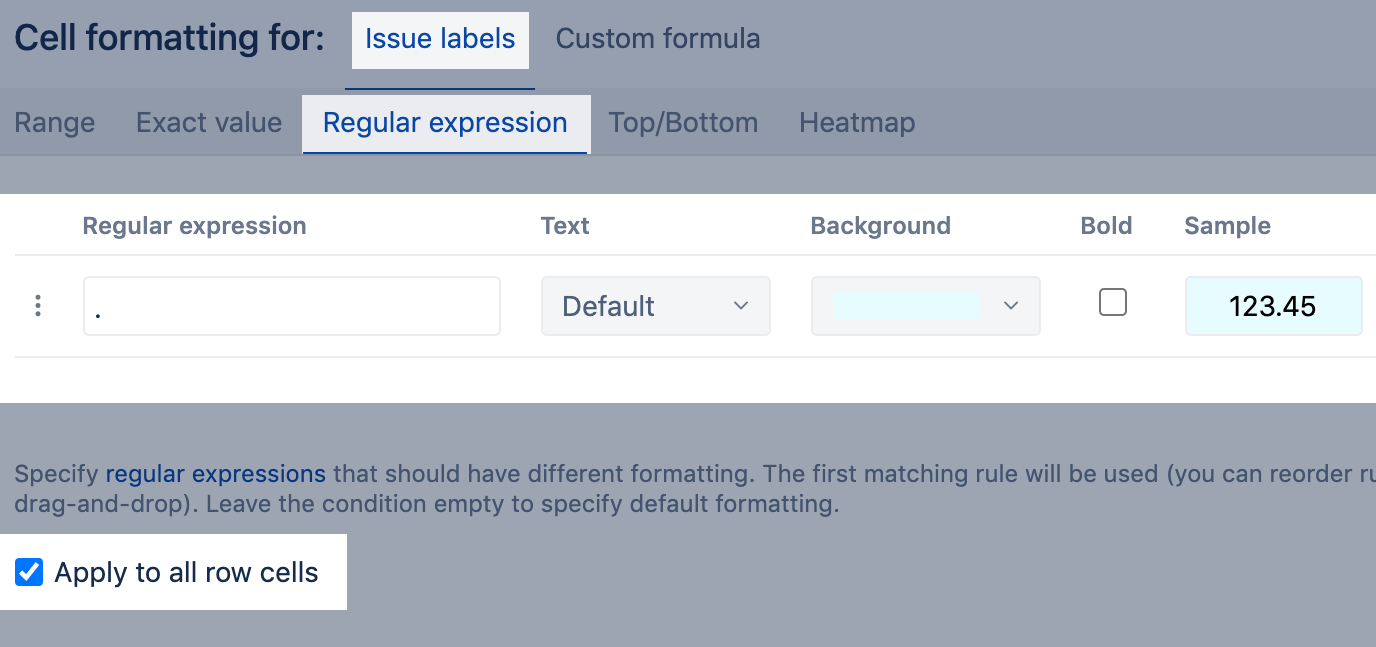
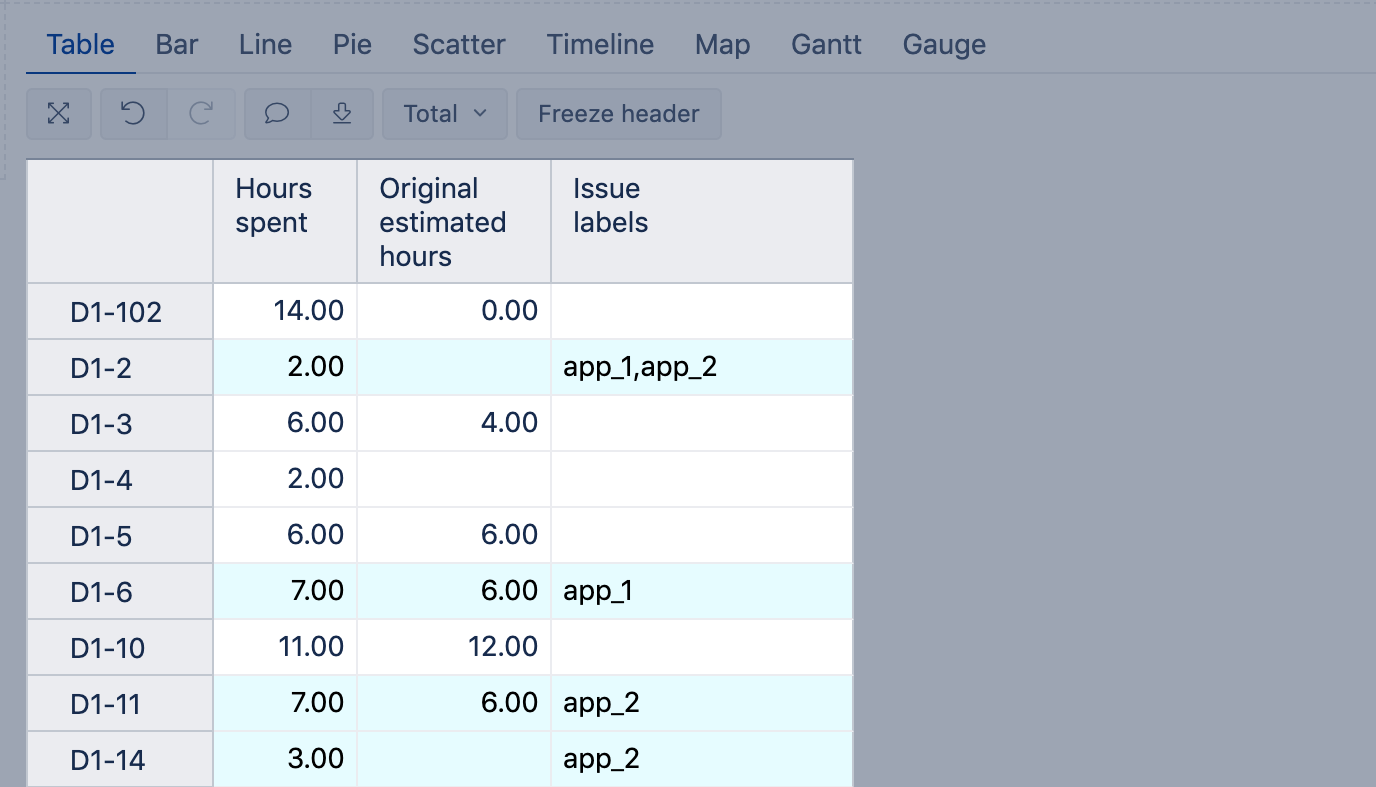
Using a regular expression, color all rows with issues having any label (i.e., having any value in the "Issue labels" column). A regular expression . is used to match any character.
Report with applied rules:
Top/Bottom
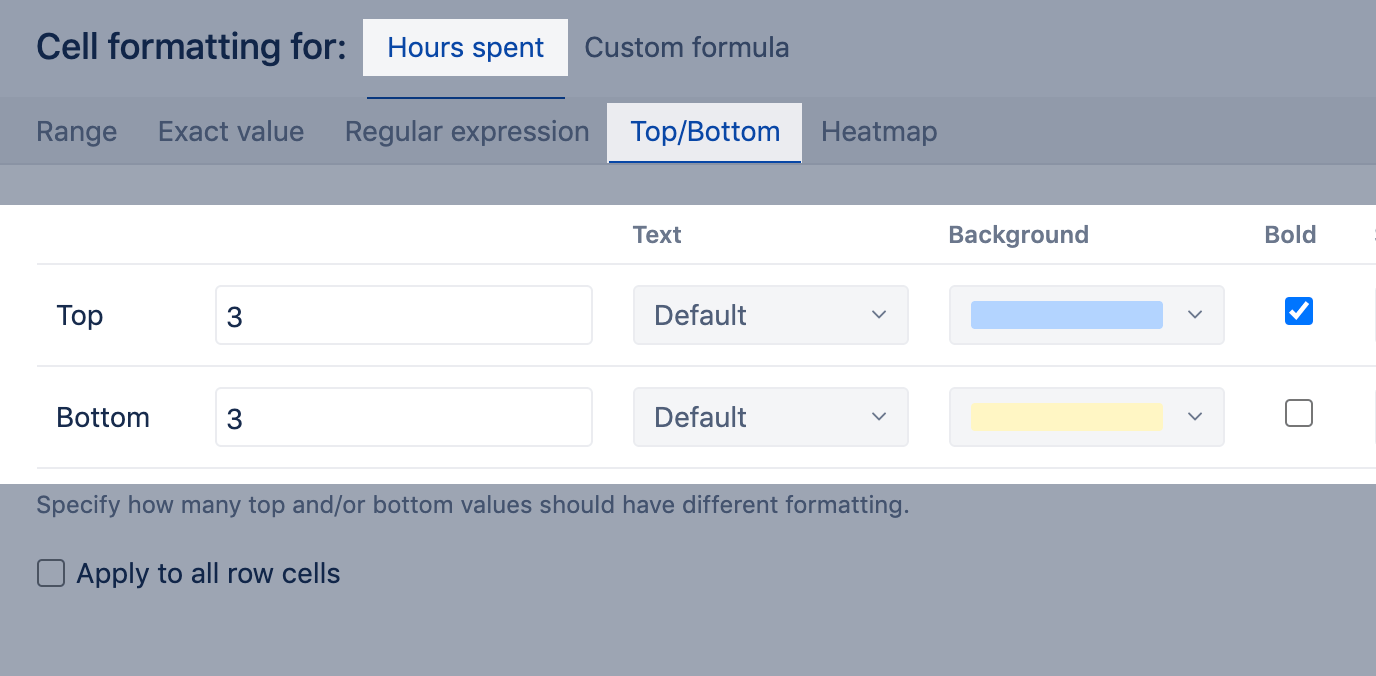
Use Top/Bottom to highlight the top and/or bottom cell values. If several values are the same then all cells matching top/bottom values are selected. This option is recommended for numeric values and dates.
Example
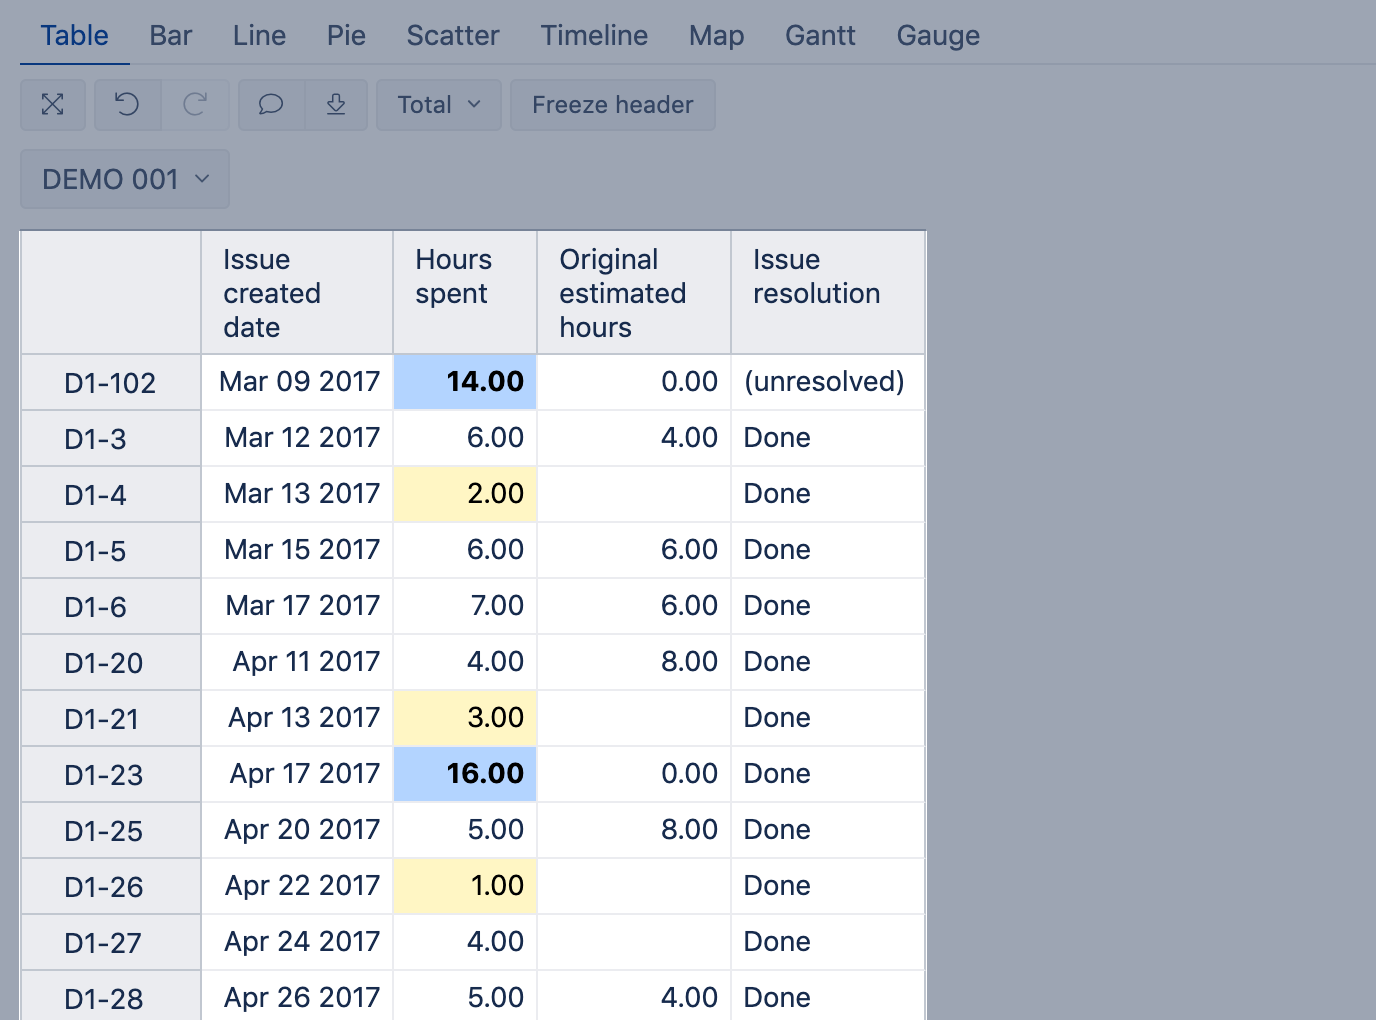
Using the Top/Bottom option, color rows with issues with three largest and smallest logged hour values. Top values also display bold.
Report with applied rules:
Heatmap
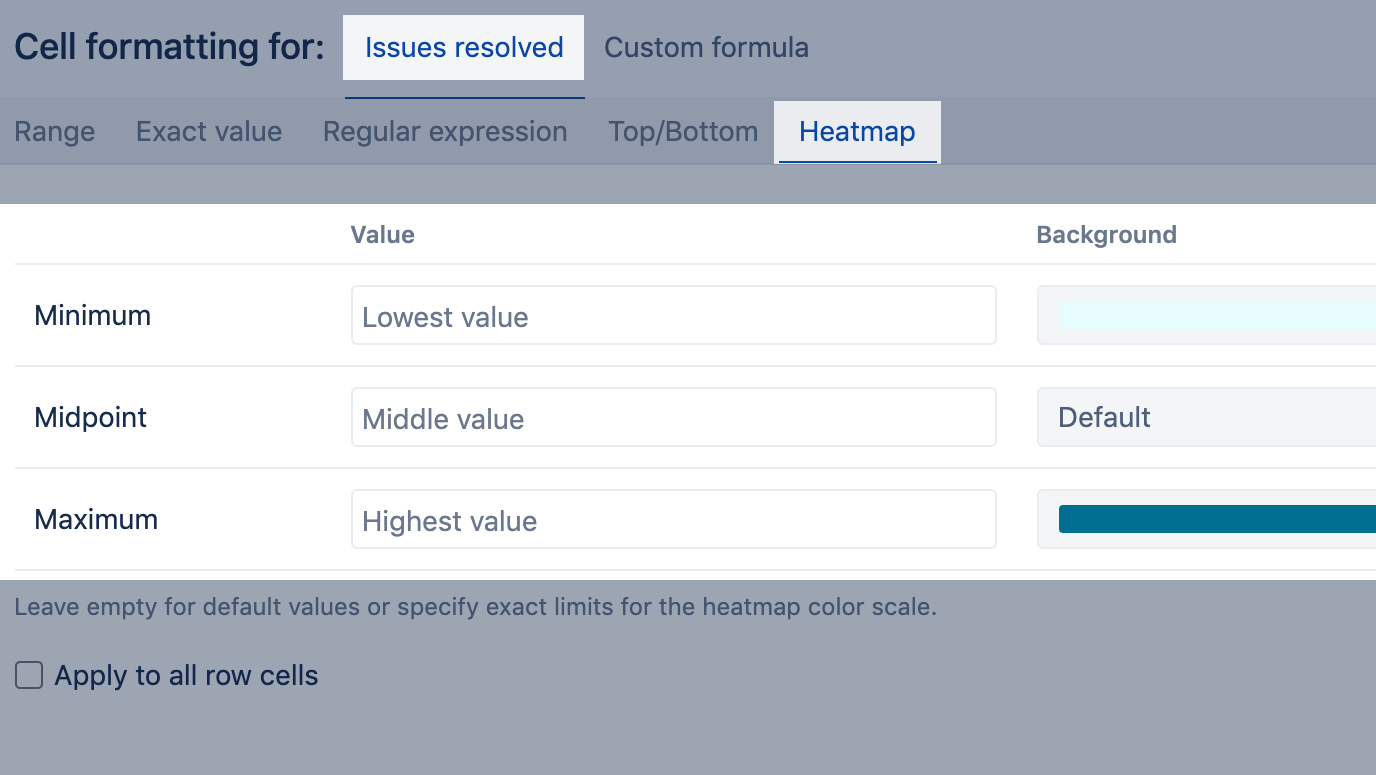
Highlight all values using different intensity colors from the specified color range. By default, minimum, midpoint, maximum values are detected automatically. If necessary, exact values could be specified. For example, specify midpoint value 0 to highlight negative values using one color and positive values using a different color. Heatmap option is recommended for numerical values and dates.
Example
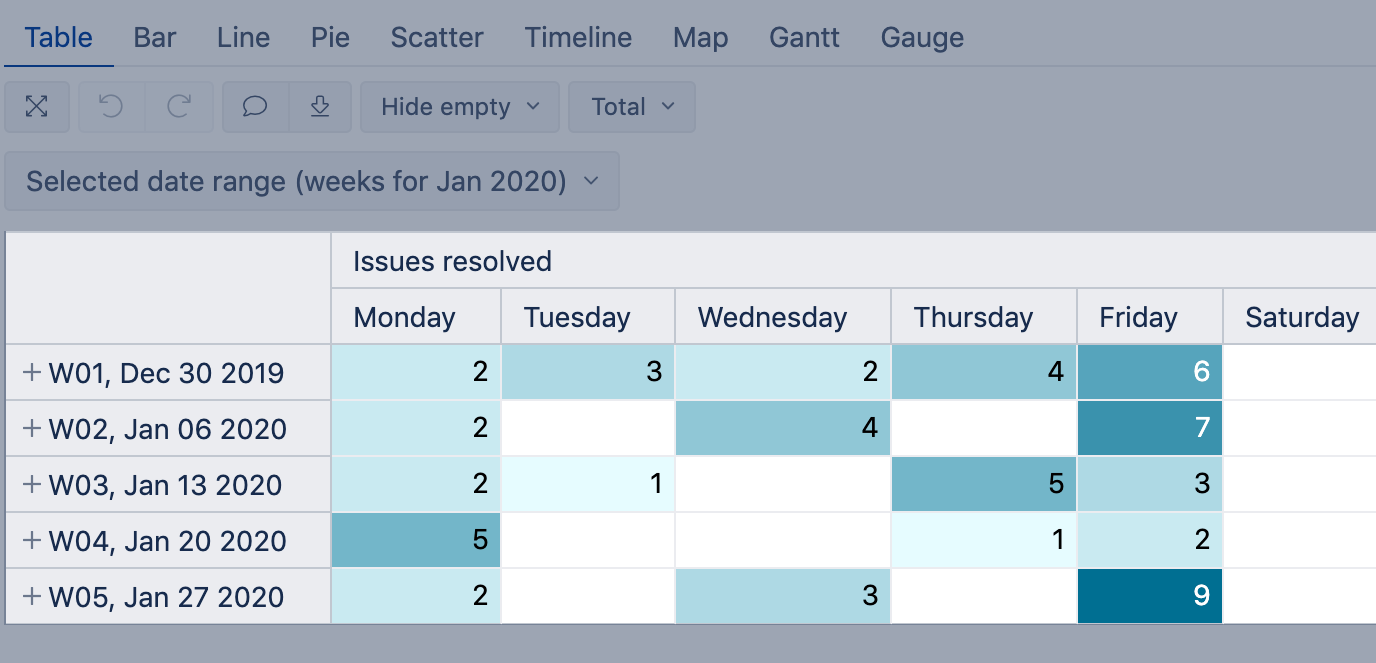
Color as a heatmap table with issues resolved where lighter color is for weekdays with fewer resolved issues and darker color - for cells with a larger number of resolved issues.
Report with applied rules:
Using custom formula
By default, the cell measure value is used for selecting the matching rule. In some specific cases, you can override it with a custom calculation formula. Custom calculations use the same MDX expressions as calculated member formulas. You may use an already existing measure as a custom calculation or write the calculation directly in this same form.
The custom formula could be used for all kinds of conditions. The data type of the result of the calculation must be the same as the data type of values in the cells the condition is set on.
Example
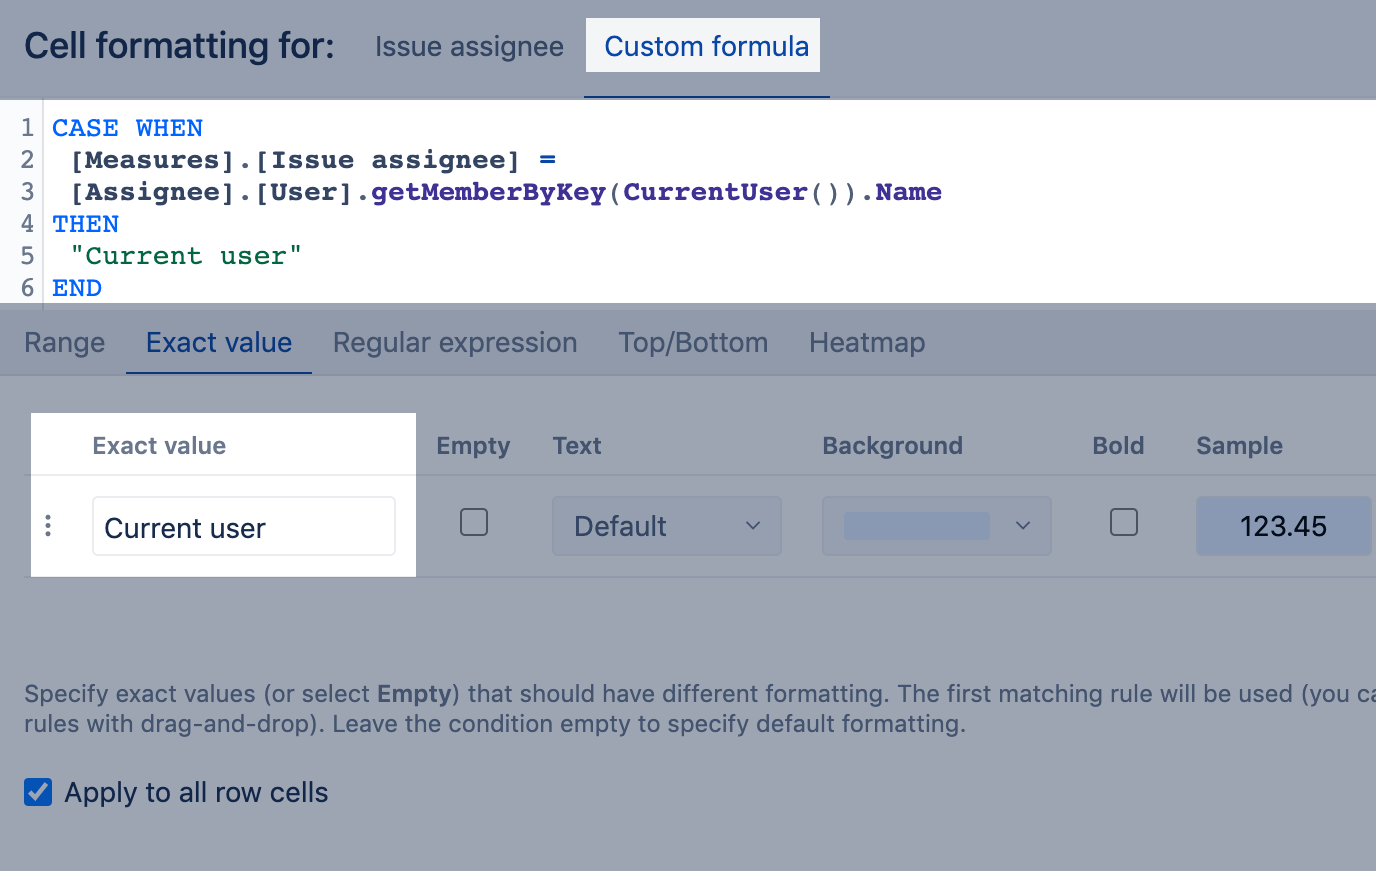
Color the background for issues assigned to me (i.e. the user who is currently logged into flex.bi). Set the condition on the Issue assignee column if present in the report or on any other text column. In the example, the conditional formatting is set on the Issue assignee column and applied to all row cells. The calculation formula returns the value "Current user" if the issue assignee is the current user; as "Current user" is a unique value, the exact value condition is used.
Report with applied rules:
Cell formatting for rows
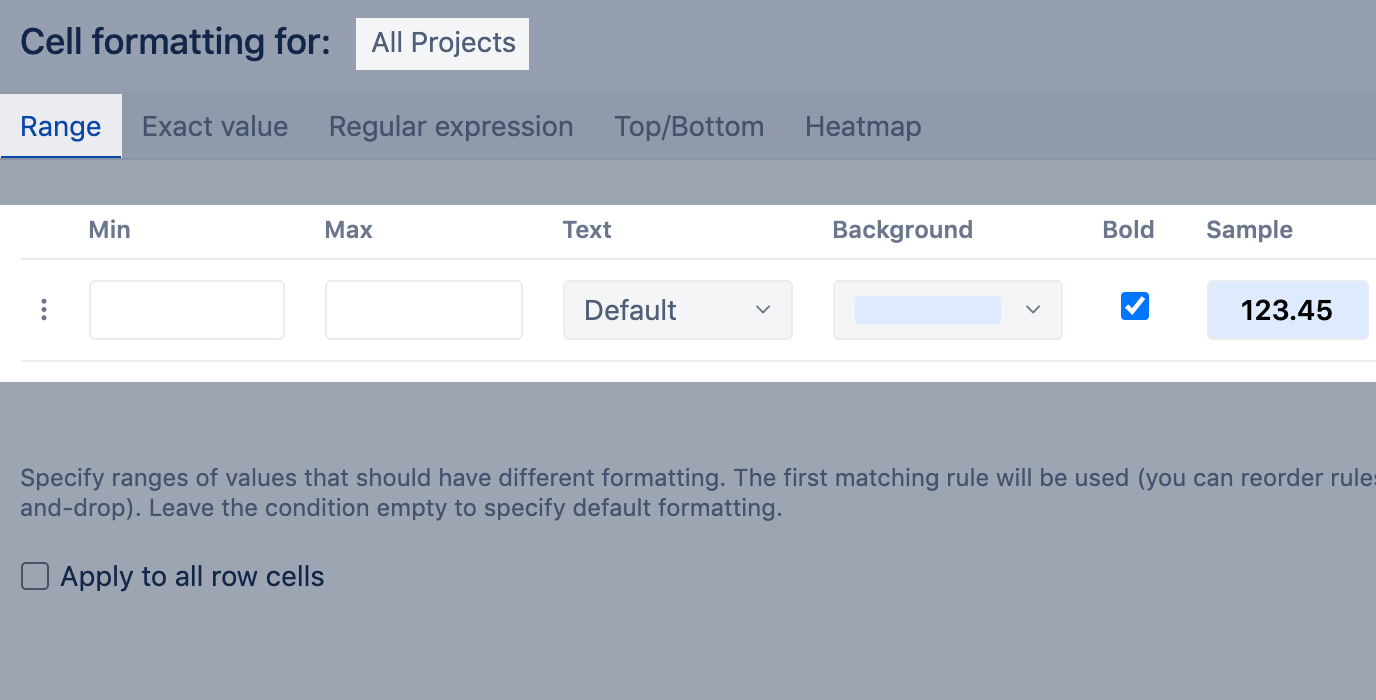
To highlight a row with total or subtotal values, apply a condition on that particular row/column.
In the Range tab, leave values empty, and select how to highlight the row/column.
Example
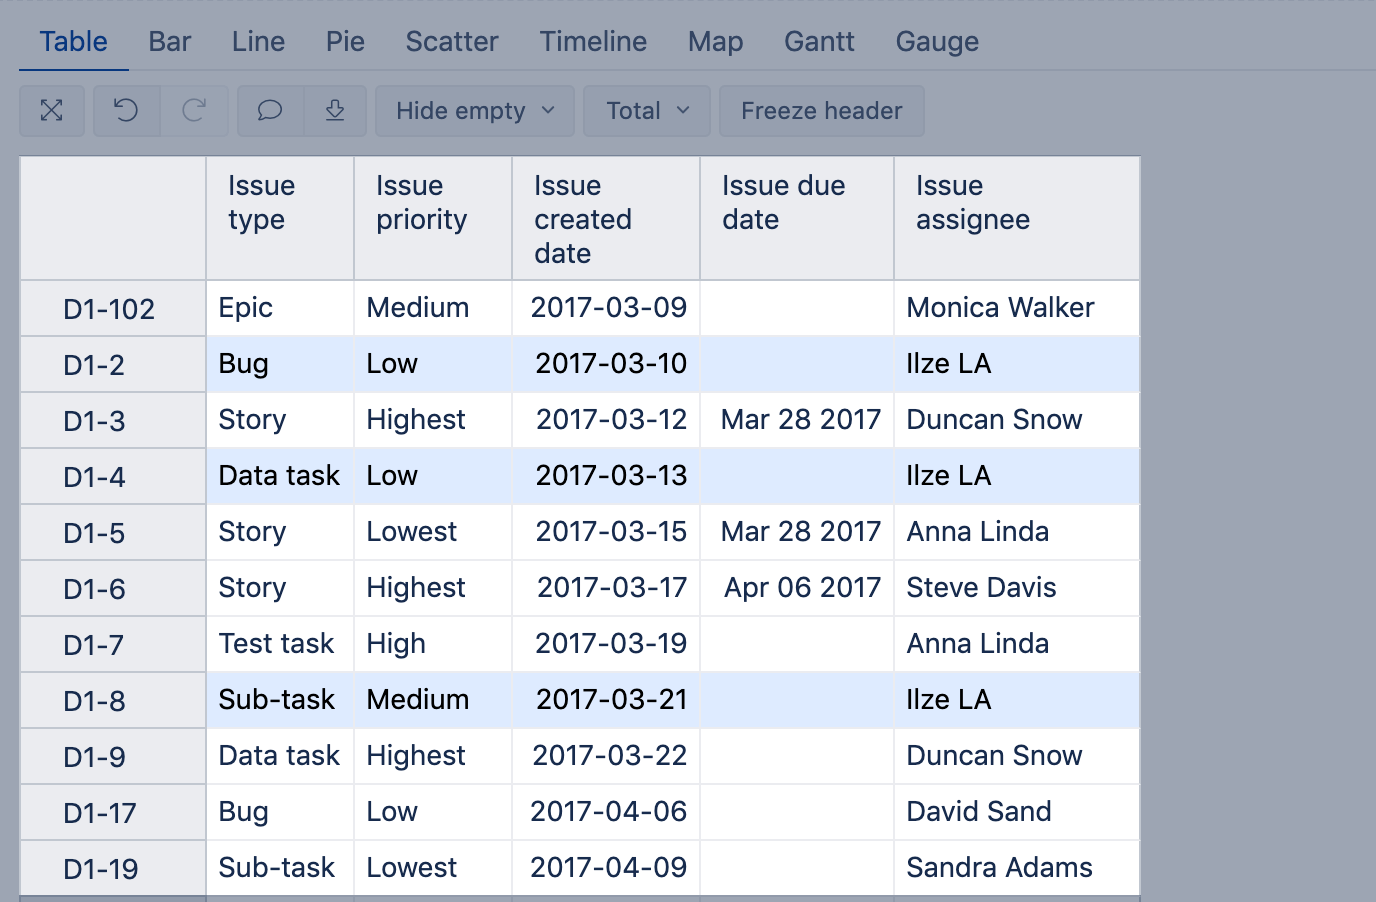
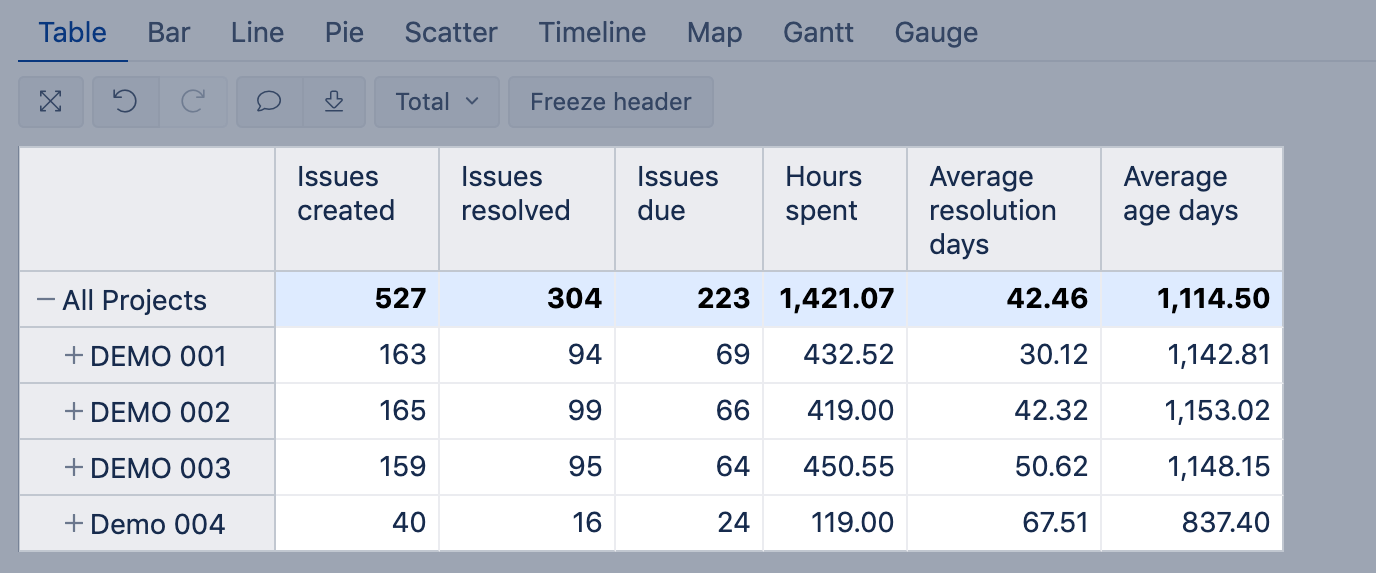
In the "All Projects" row, show all values on pale blue background with bold font.
Report with applied rules:
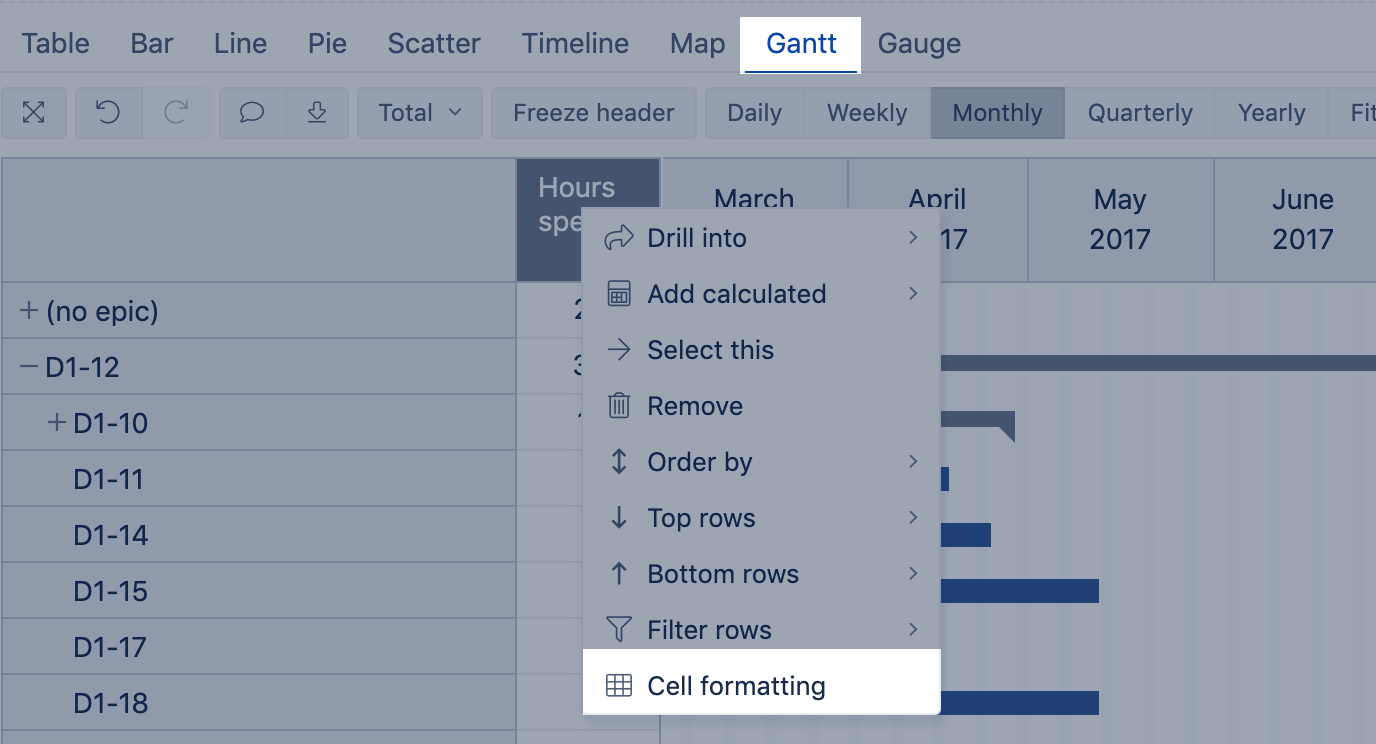
Cell formatting for Gantt charts
Use all cell formatting options in the Gantt chart table. To apply them in the chart, go to the Gantt tab and select Cell formatting from there. All cell formatting options available in tables are also available in the Gantt chart table.
Conditional formatting for cells in the Gantt is set separately from the condition formatting for cells in the report Table view!