Charts conditional formatting
Use conditional formatting in charts (bar, line, timeline) to highlight individual bars, ranges, scatters, or bubbles.
How to use condition cell formatting in tables and Gantt chart, read Conditional cell formatting.
Overview
Conditional formatting is available in bar, line, and timeline [1] charts for types: bar, scatter, range, and bubble [2].
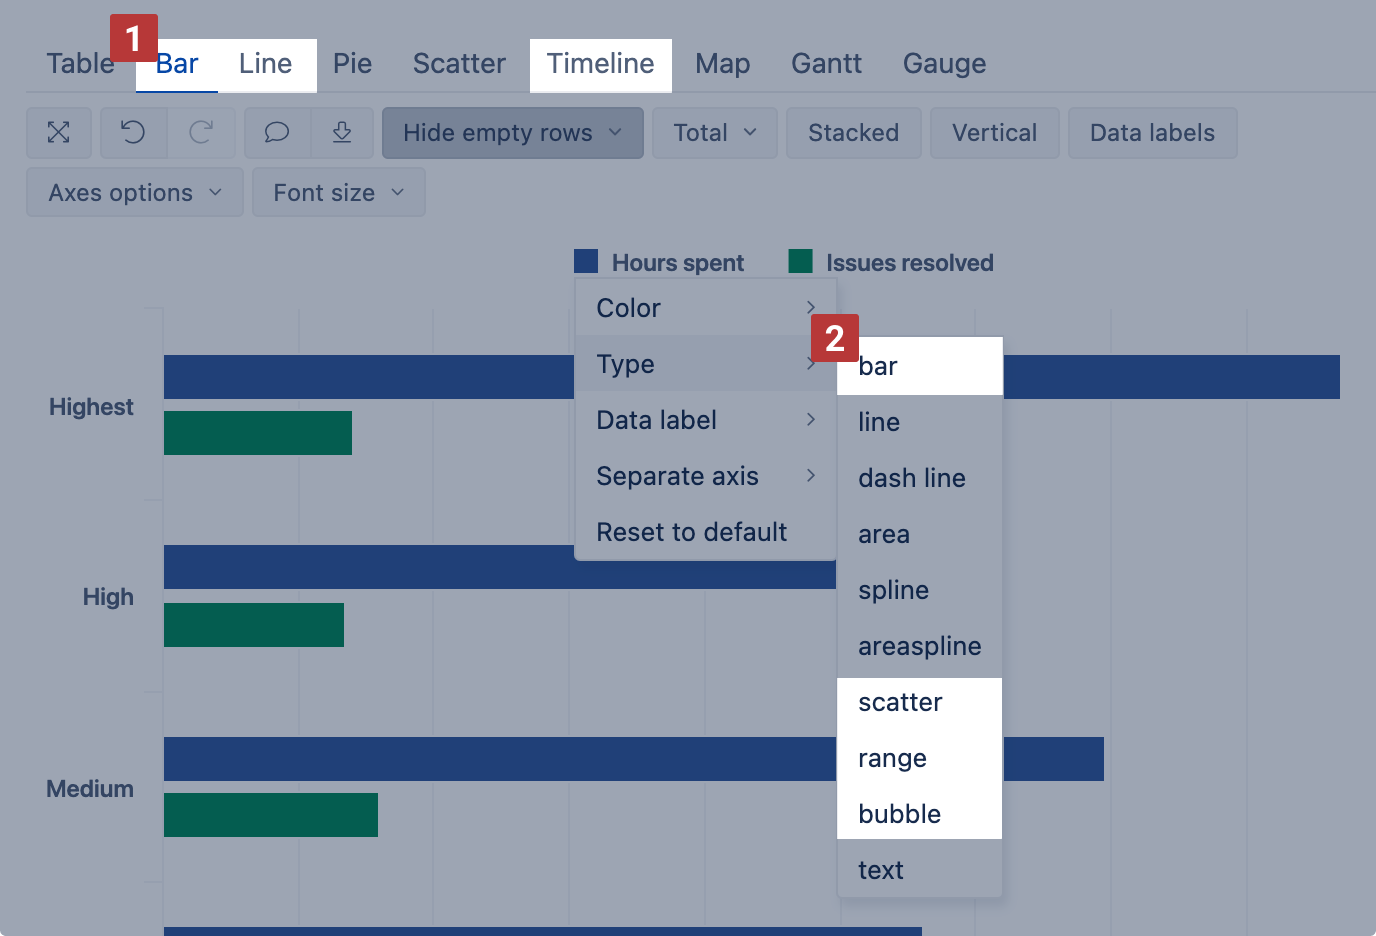
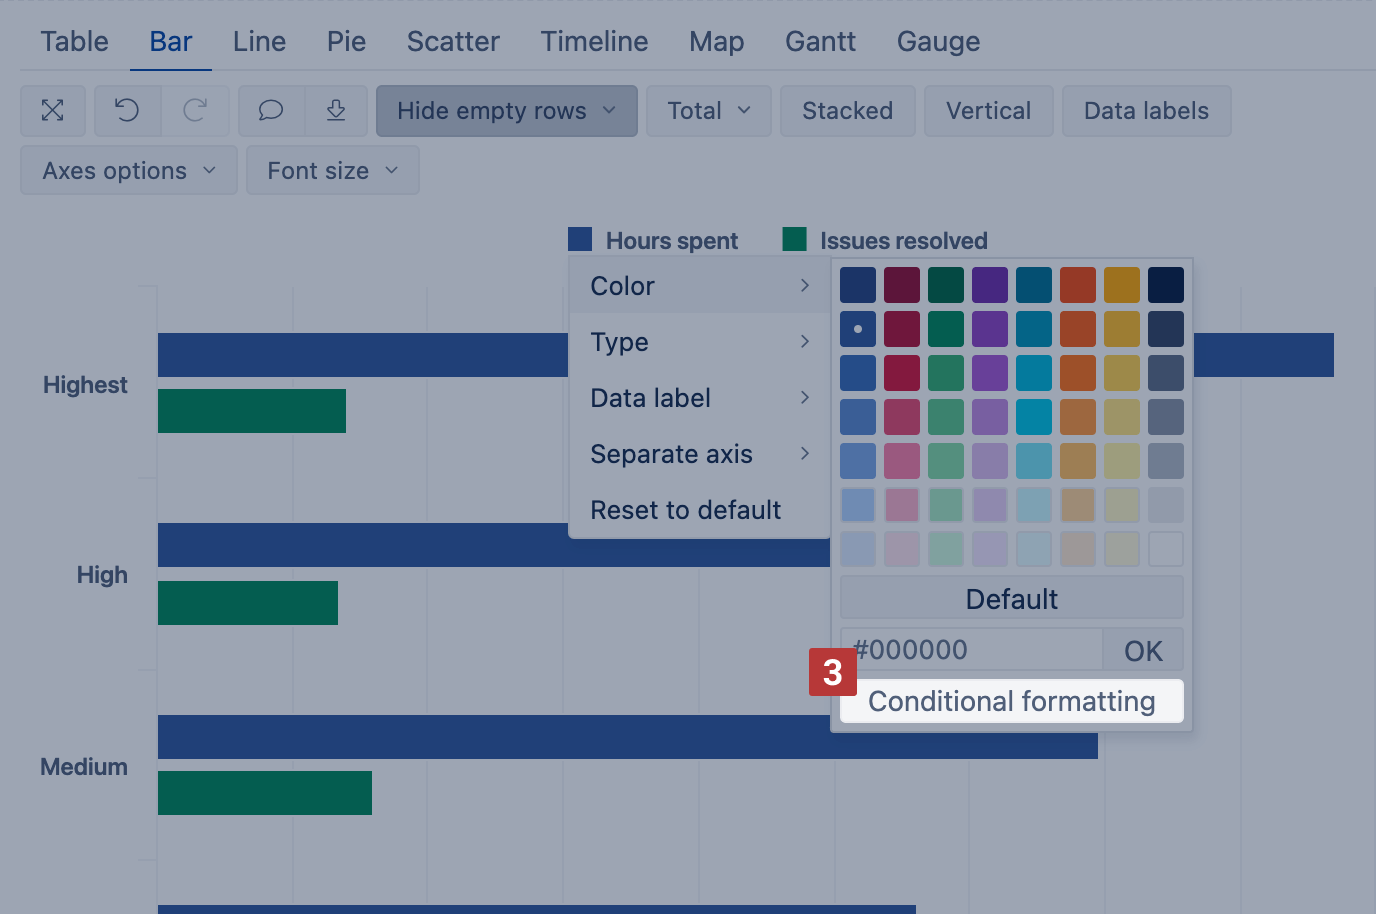
Select Conditional formatting [3] for the measure if its type is bar, scatter, range, or bubble.
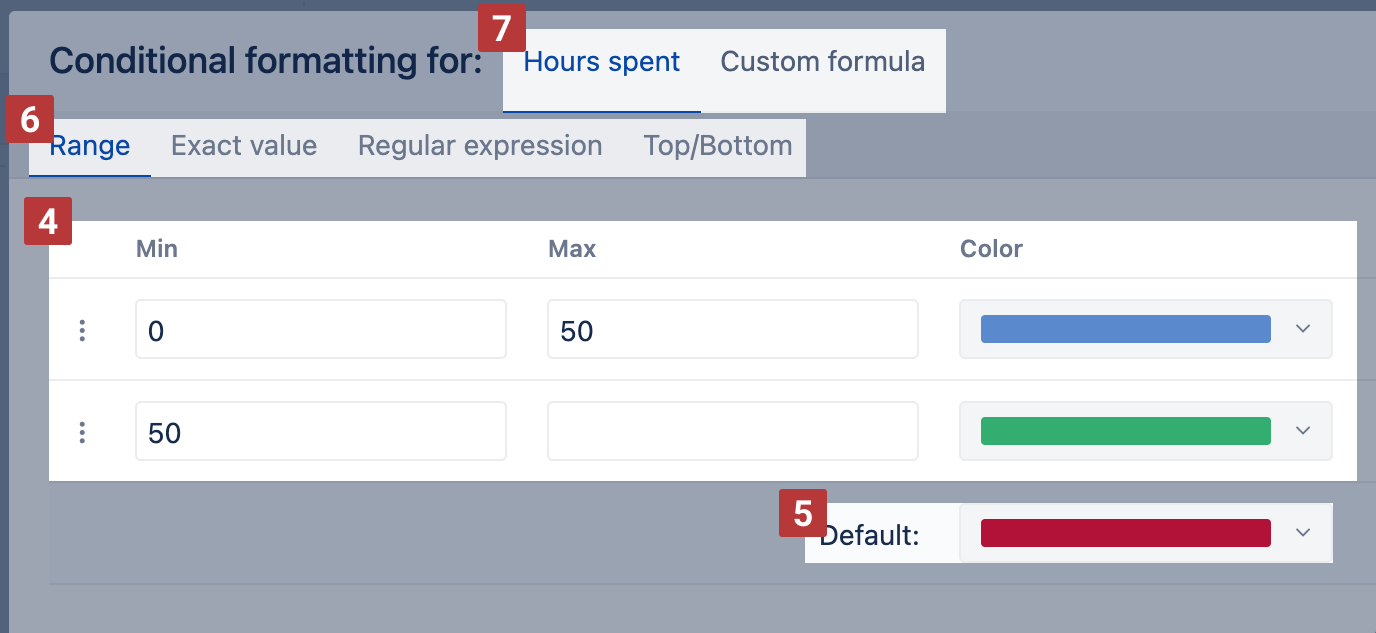
Specify one or several rules [4] to detect charts that should have different colors. You can set one or multiple rules, the first matching rule will be used. If no rule is applied, then the default color is used for the chart [5].
There are two ways how to apply those rules [7]: you can set them on the values displayed in the charts or on the value calculated by a custom formula. Also, there are several ways to define conditions [6]: Range, Exact value, Regular expression, and Top/Bottom. Select one of them.
Range
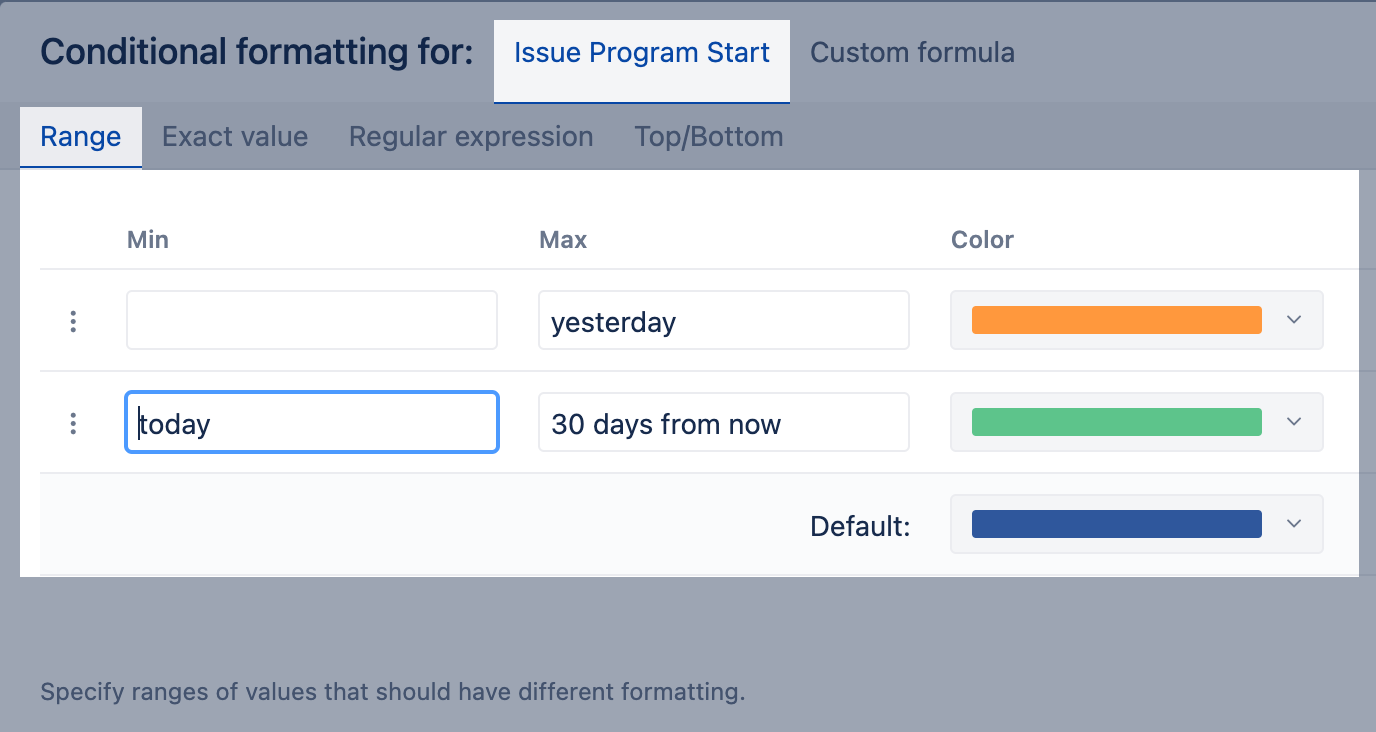
Specify ranges of values that should have different formatting. Can be used for numeric values, percentages, dates, or file sizes. Both min and max end-point values are included in the range.
For dates, use exact dates or relative dates to define a range. If the date is a DateTime value (also has a precise time, e.g. Issue creation date, Issue resolution date), the start of this date (00:00) is always used, take it into account when defining Max value (add one more day).
For percentage values, include % sign (e.g. 10%).
Example
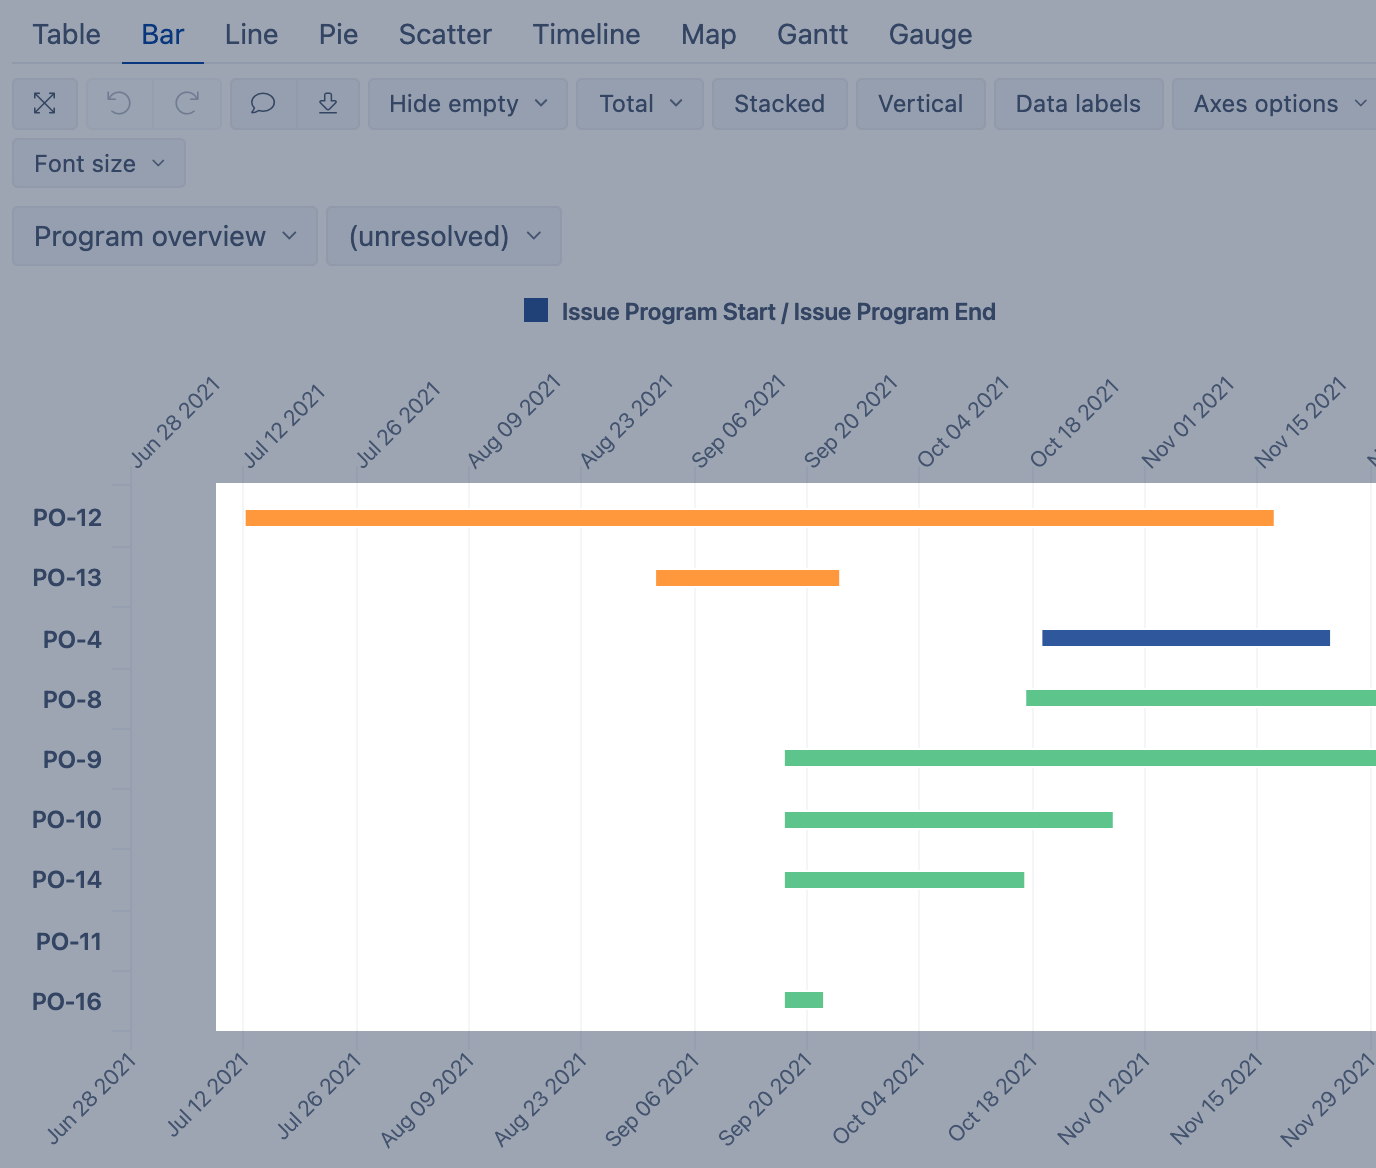
Using relative dates, color-code ranges based on issue start date: is already started, will start from today within next 30 days, and starts after 30 days in future (default color).
Range chart with applied rules for range chart (the report was run on Sep 17, 2021):
Exact value
Use exact value to apply rules for text or integer values. This approach is recommended if you have a few specific or unique values (e.g., statuses for texts, story points for numbers) and you want to color-code charts by them. Use precise and case-sensitive values.
Example
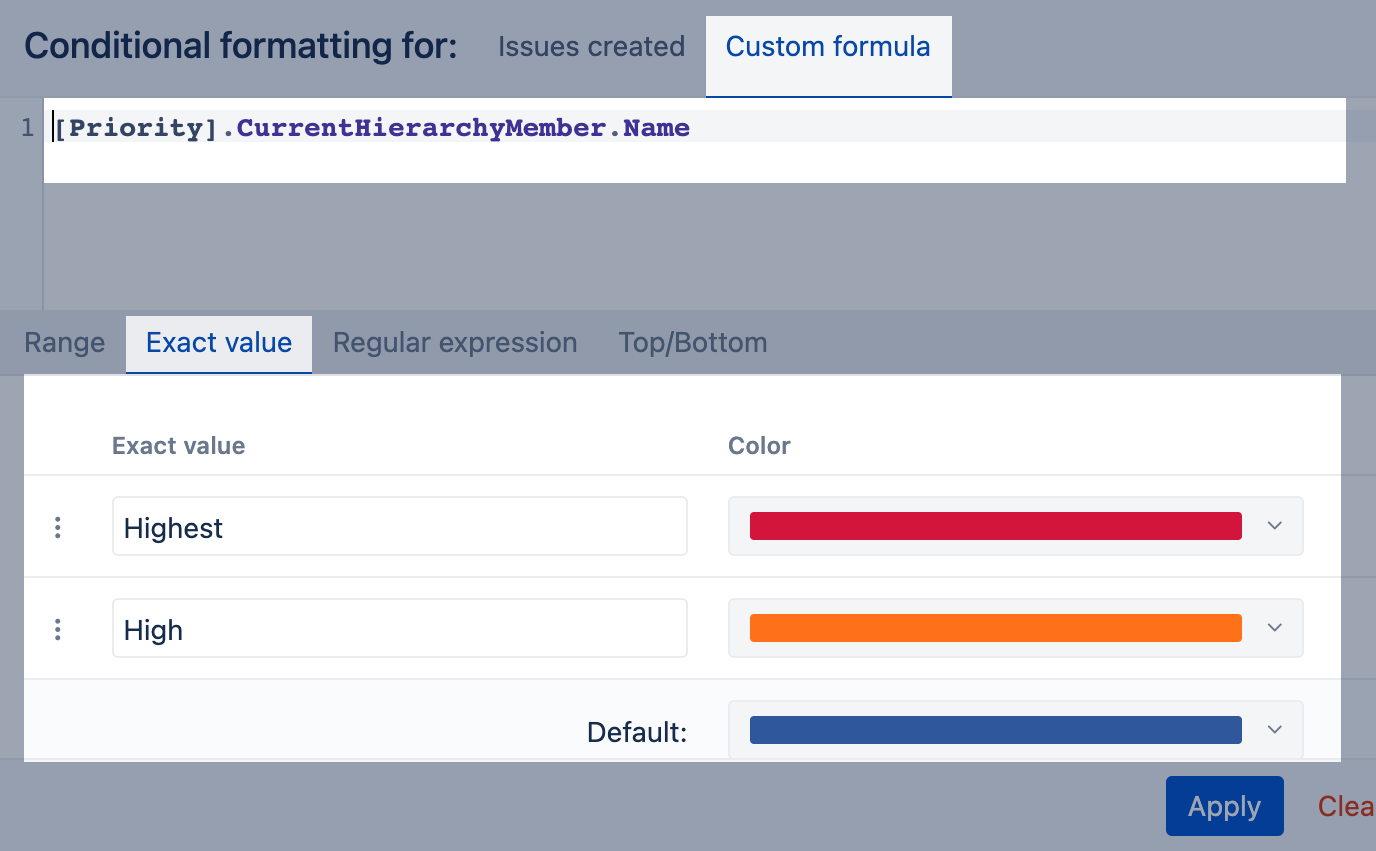
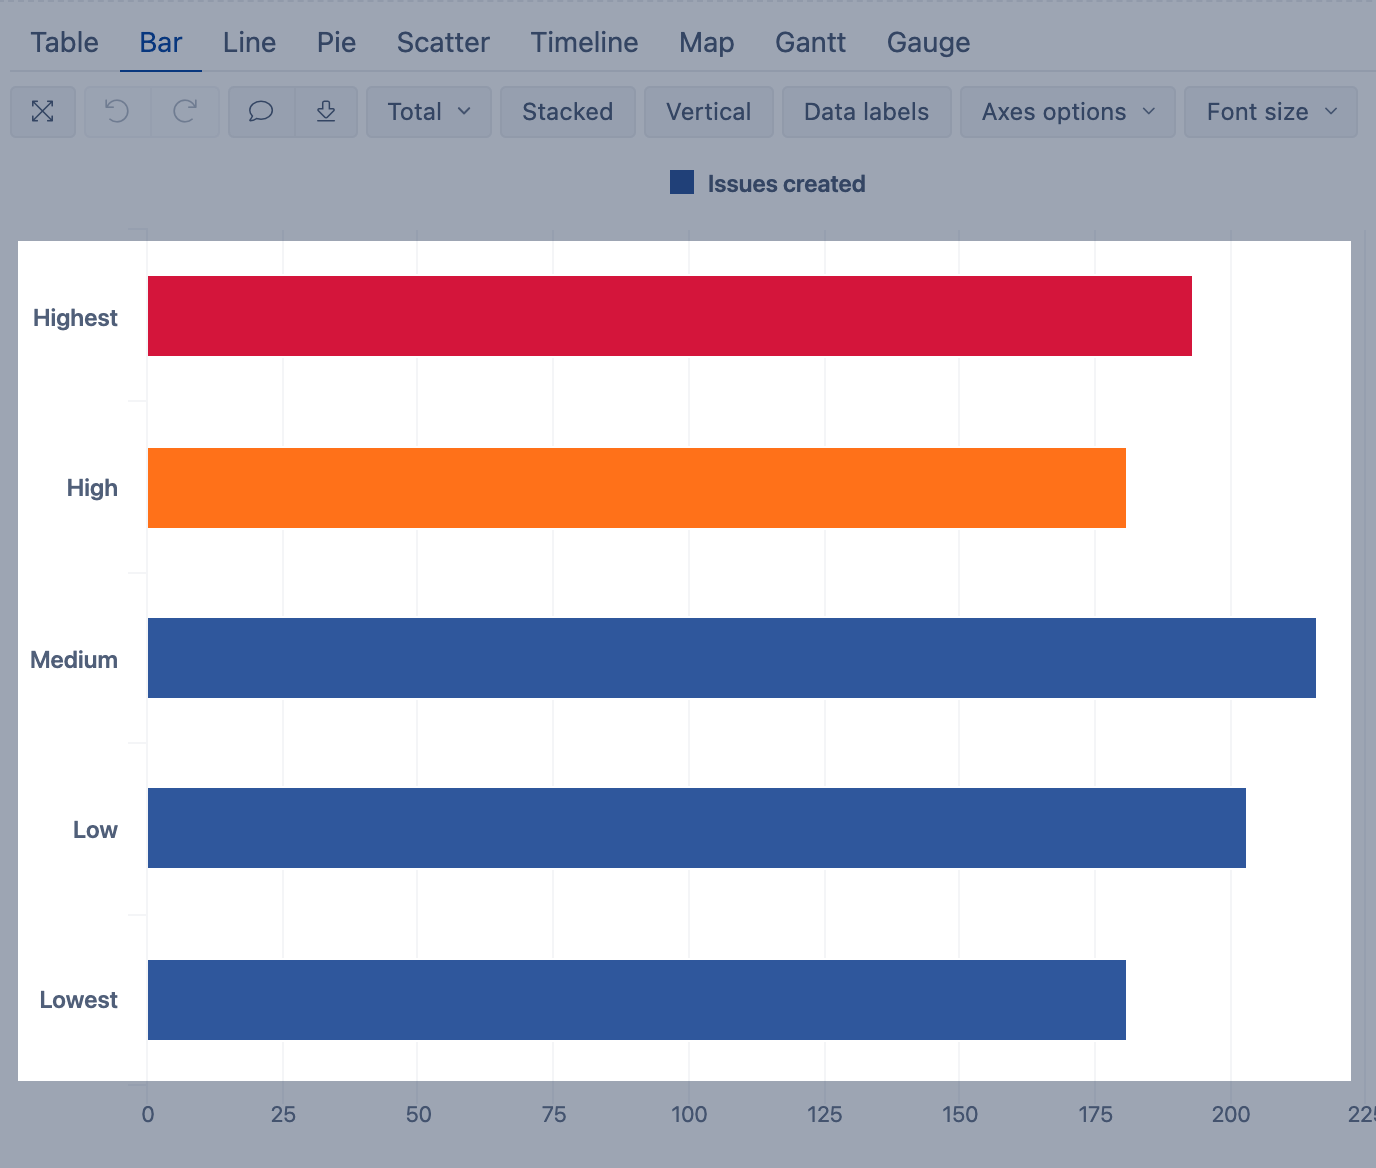
Using exact value condition together with custom formula, change bar color for priority Highest to red and High to orange.
Bar chart with applied rules:
Regular expression
Use regular expression to apply rules for text containing some pattern (e.g., starts, ends, or contains specific characters). Use Regular expressions to define the pattern. When used for date values then the date text representation (using the measure date formatting) will be used.
Example
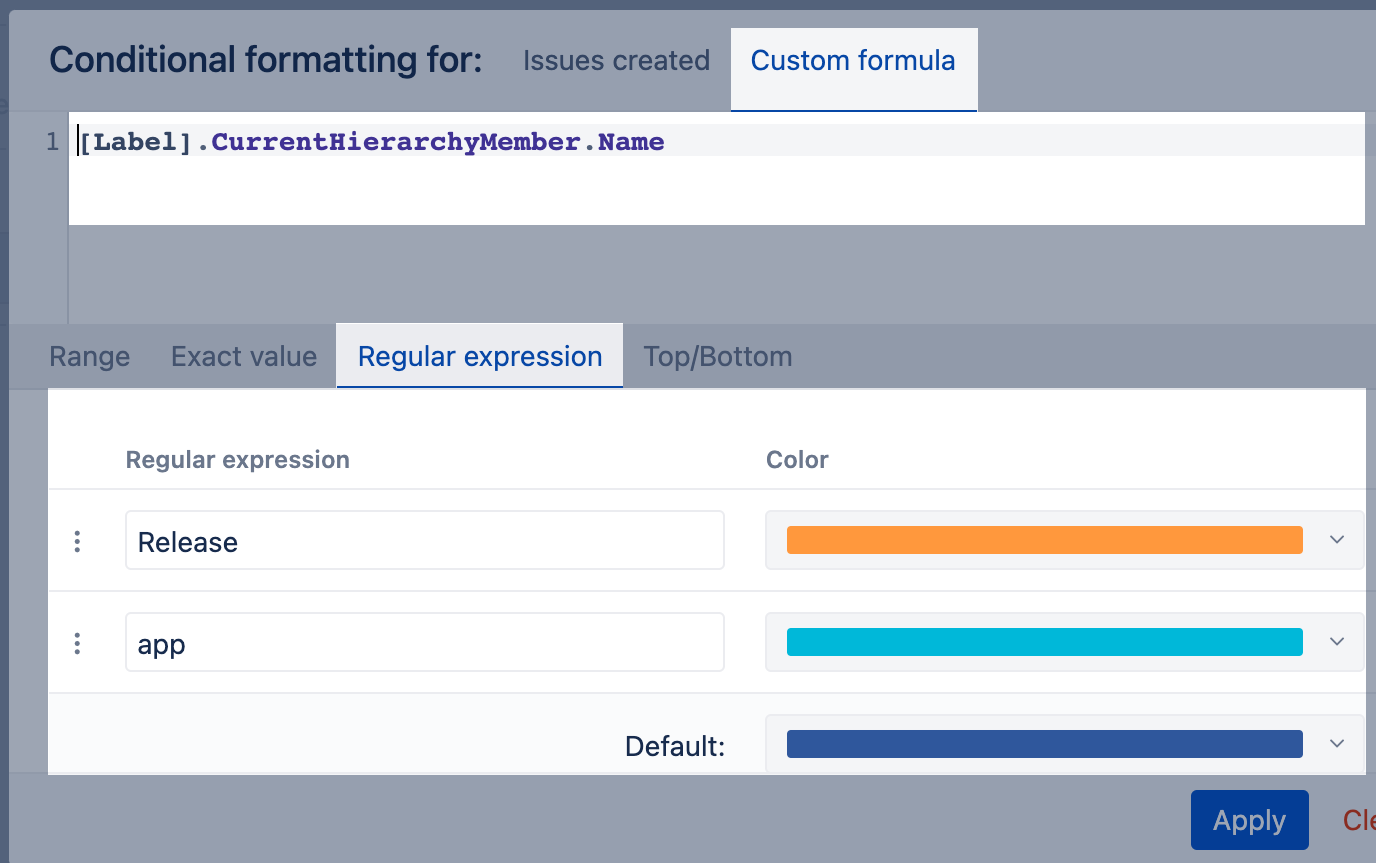
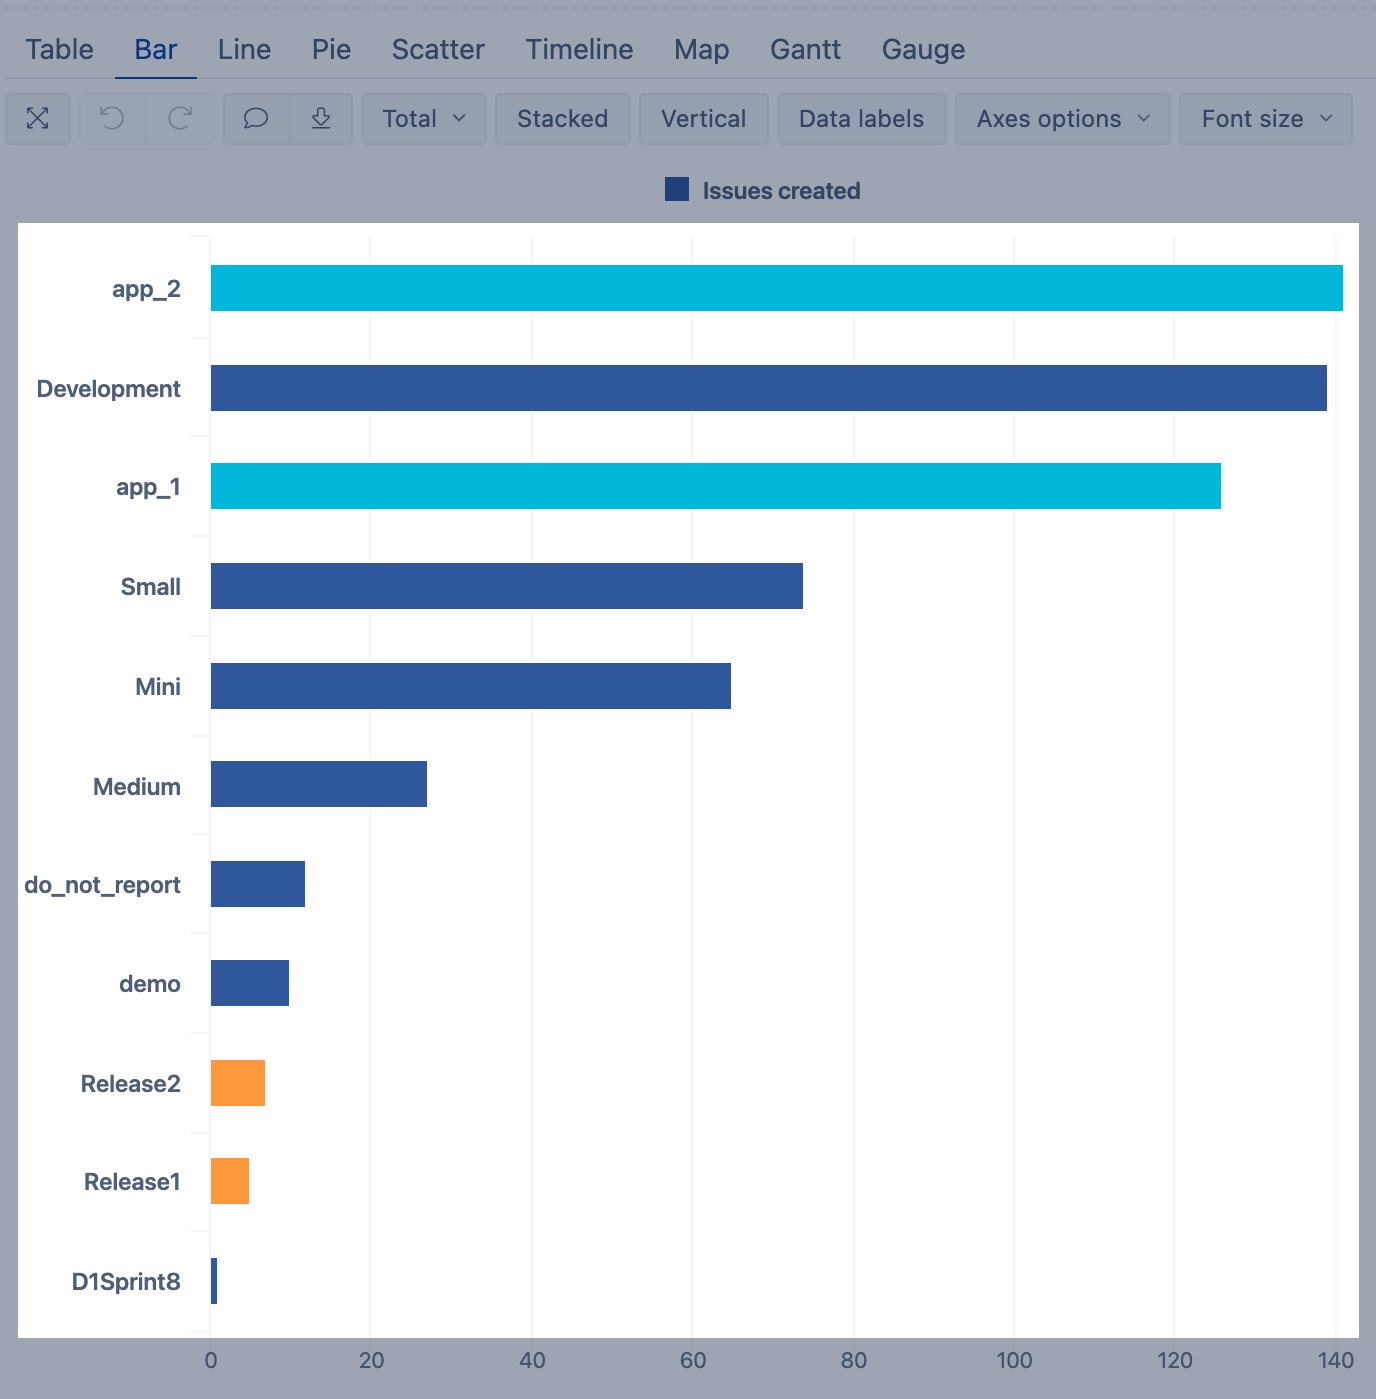
Using a regular expression together with custom formula, color all labels that contains the name Release in orange or app in blue.
Bar chart with applied rules:
Top/Bottom
Use Top/Bottom to highlight the top and/or bottom cell values. If several values are the same then all cells matching top/bottom values are selected. This option is recommended for numeric values and dates.
Example
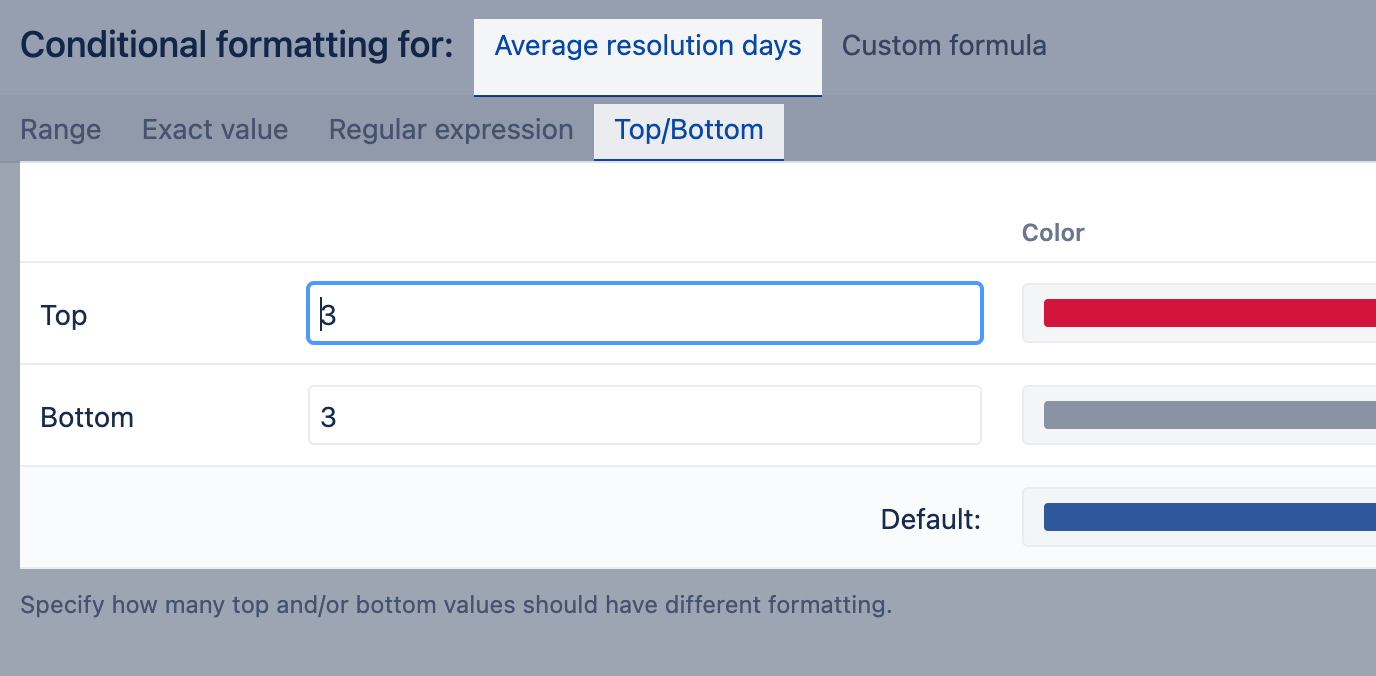
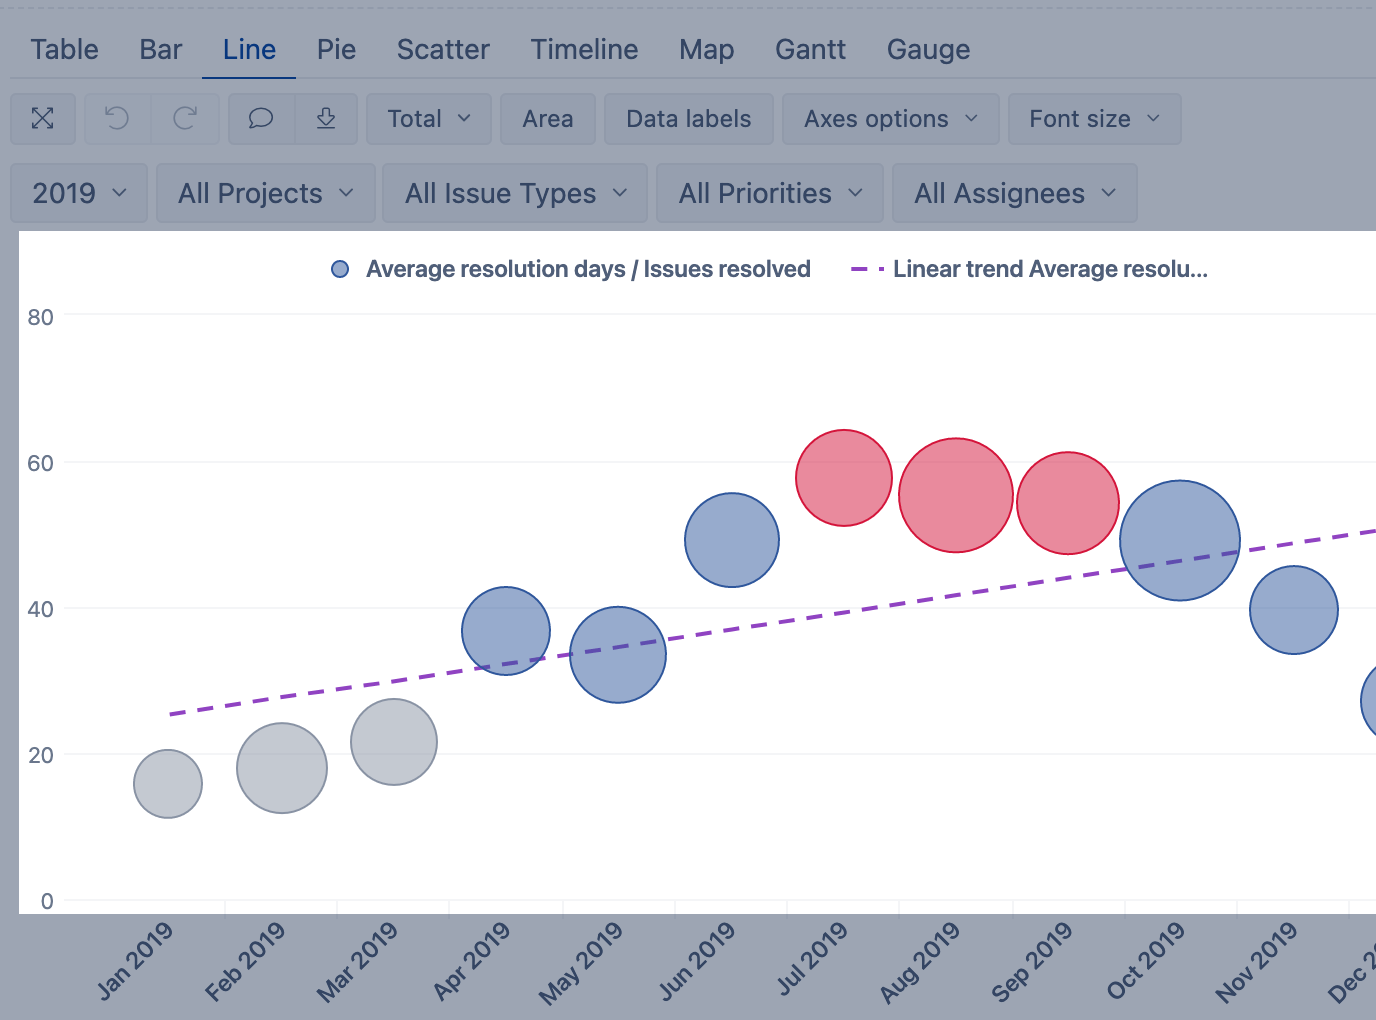
Using the Top/Bottom option, color bubble for Average resolution days/Issues resolved that have the three largest and smallest average resolution days.
Bubble chart with applied rules:
Using custom formula
By default, the chart measure value is used for selecting the matching rule. In some specific cases, you can override it with a custom calculation formula. Custom calculations use the same MDX expressions as calculated member formulas. You may use an already existing measure as a custom calculation or write the calculation directly in the form.
The custom formula could be used for all kinds of conditions. The data type of the result of the calculation must be the same as the data type of values in the cells the condition is set on.
Example
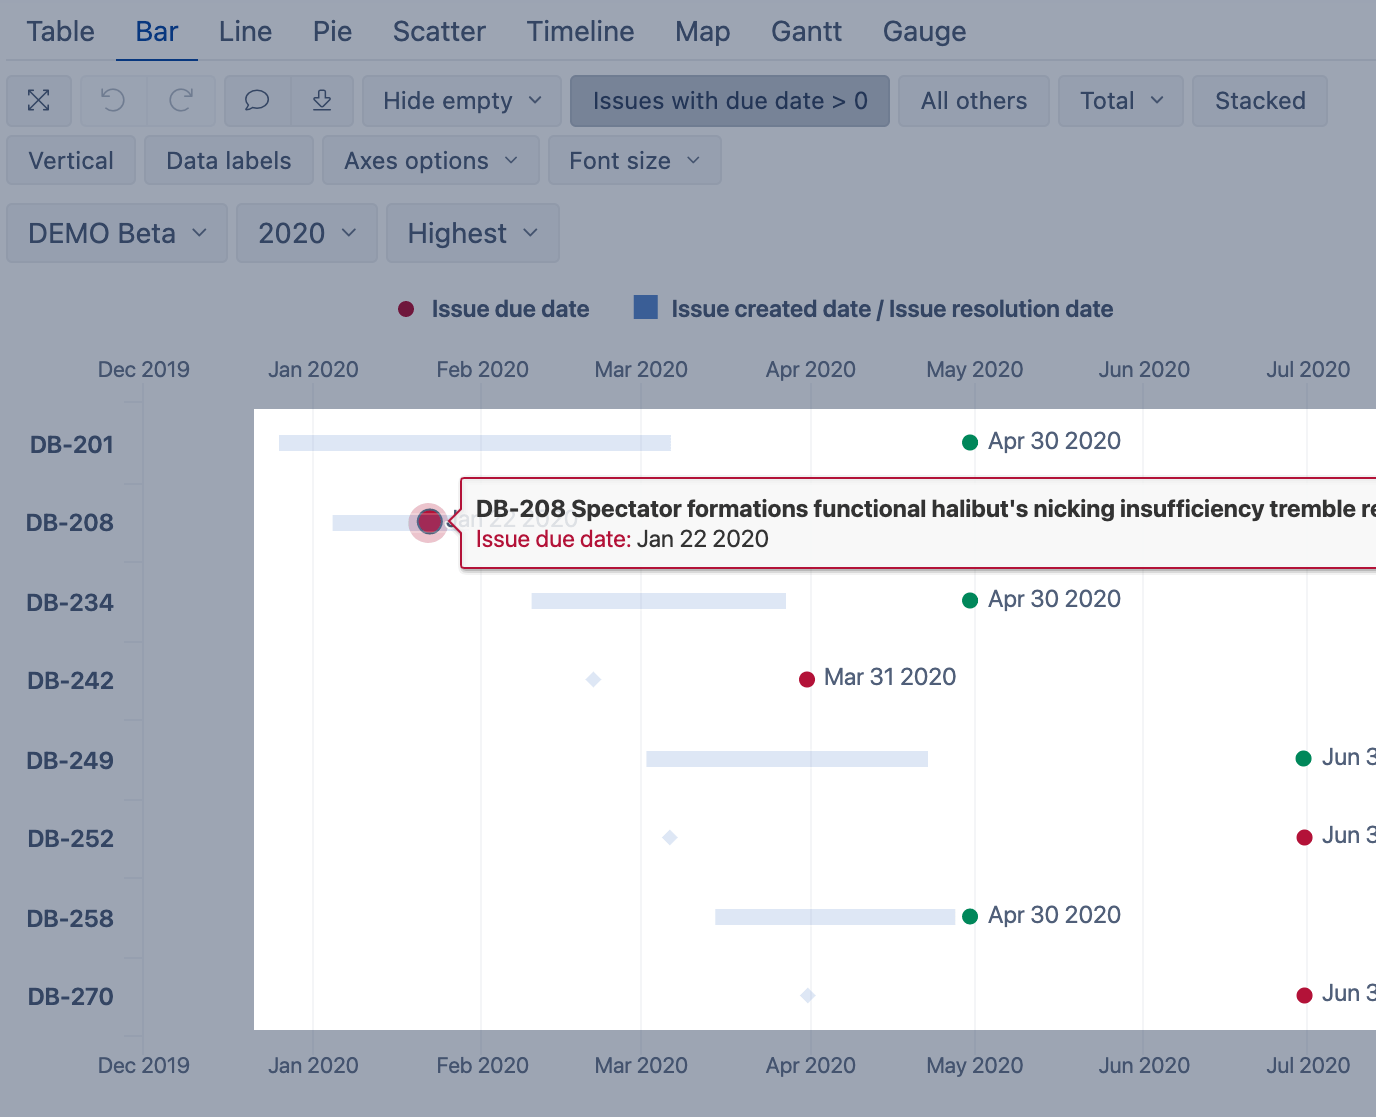
Color the issue due date (scatter points) in green, if the due date is after the resolution time (the issues are on time) or the default value red is applied if the due date is before the resolution date or before today (in case the resolution is not set).
CASE WHEN
  NOT IsEmpty([Measures].[Issue resolution date])
THEN
  CASE WHEN
	DateCompare([Measures].[Issue resolution date], [Measures].[Issue due date]) < 0
  THEN "On time"
  END
WHEN
  DateCompare([Measures].[Issue due date],"today") > 0
  THEN "On time"
END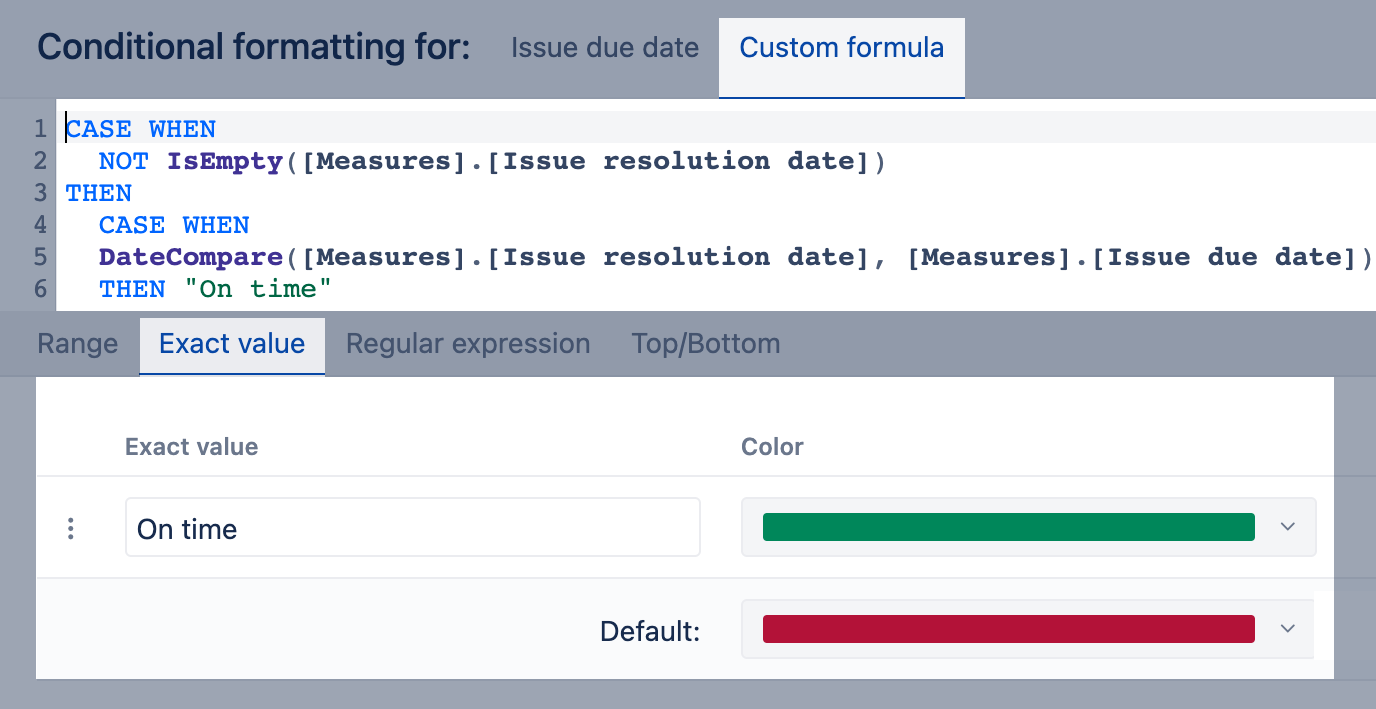
Scatter chart with applied rules: