
flex.bi reports are responsive; users can interact with a report while creating or editing it and when it is published. Interactions allow shaping report layout, focusing on specific data, seeing data from another perspective (drilling across other dimensions), and adding standard calculations.
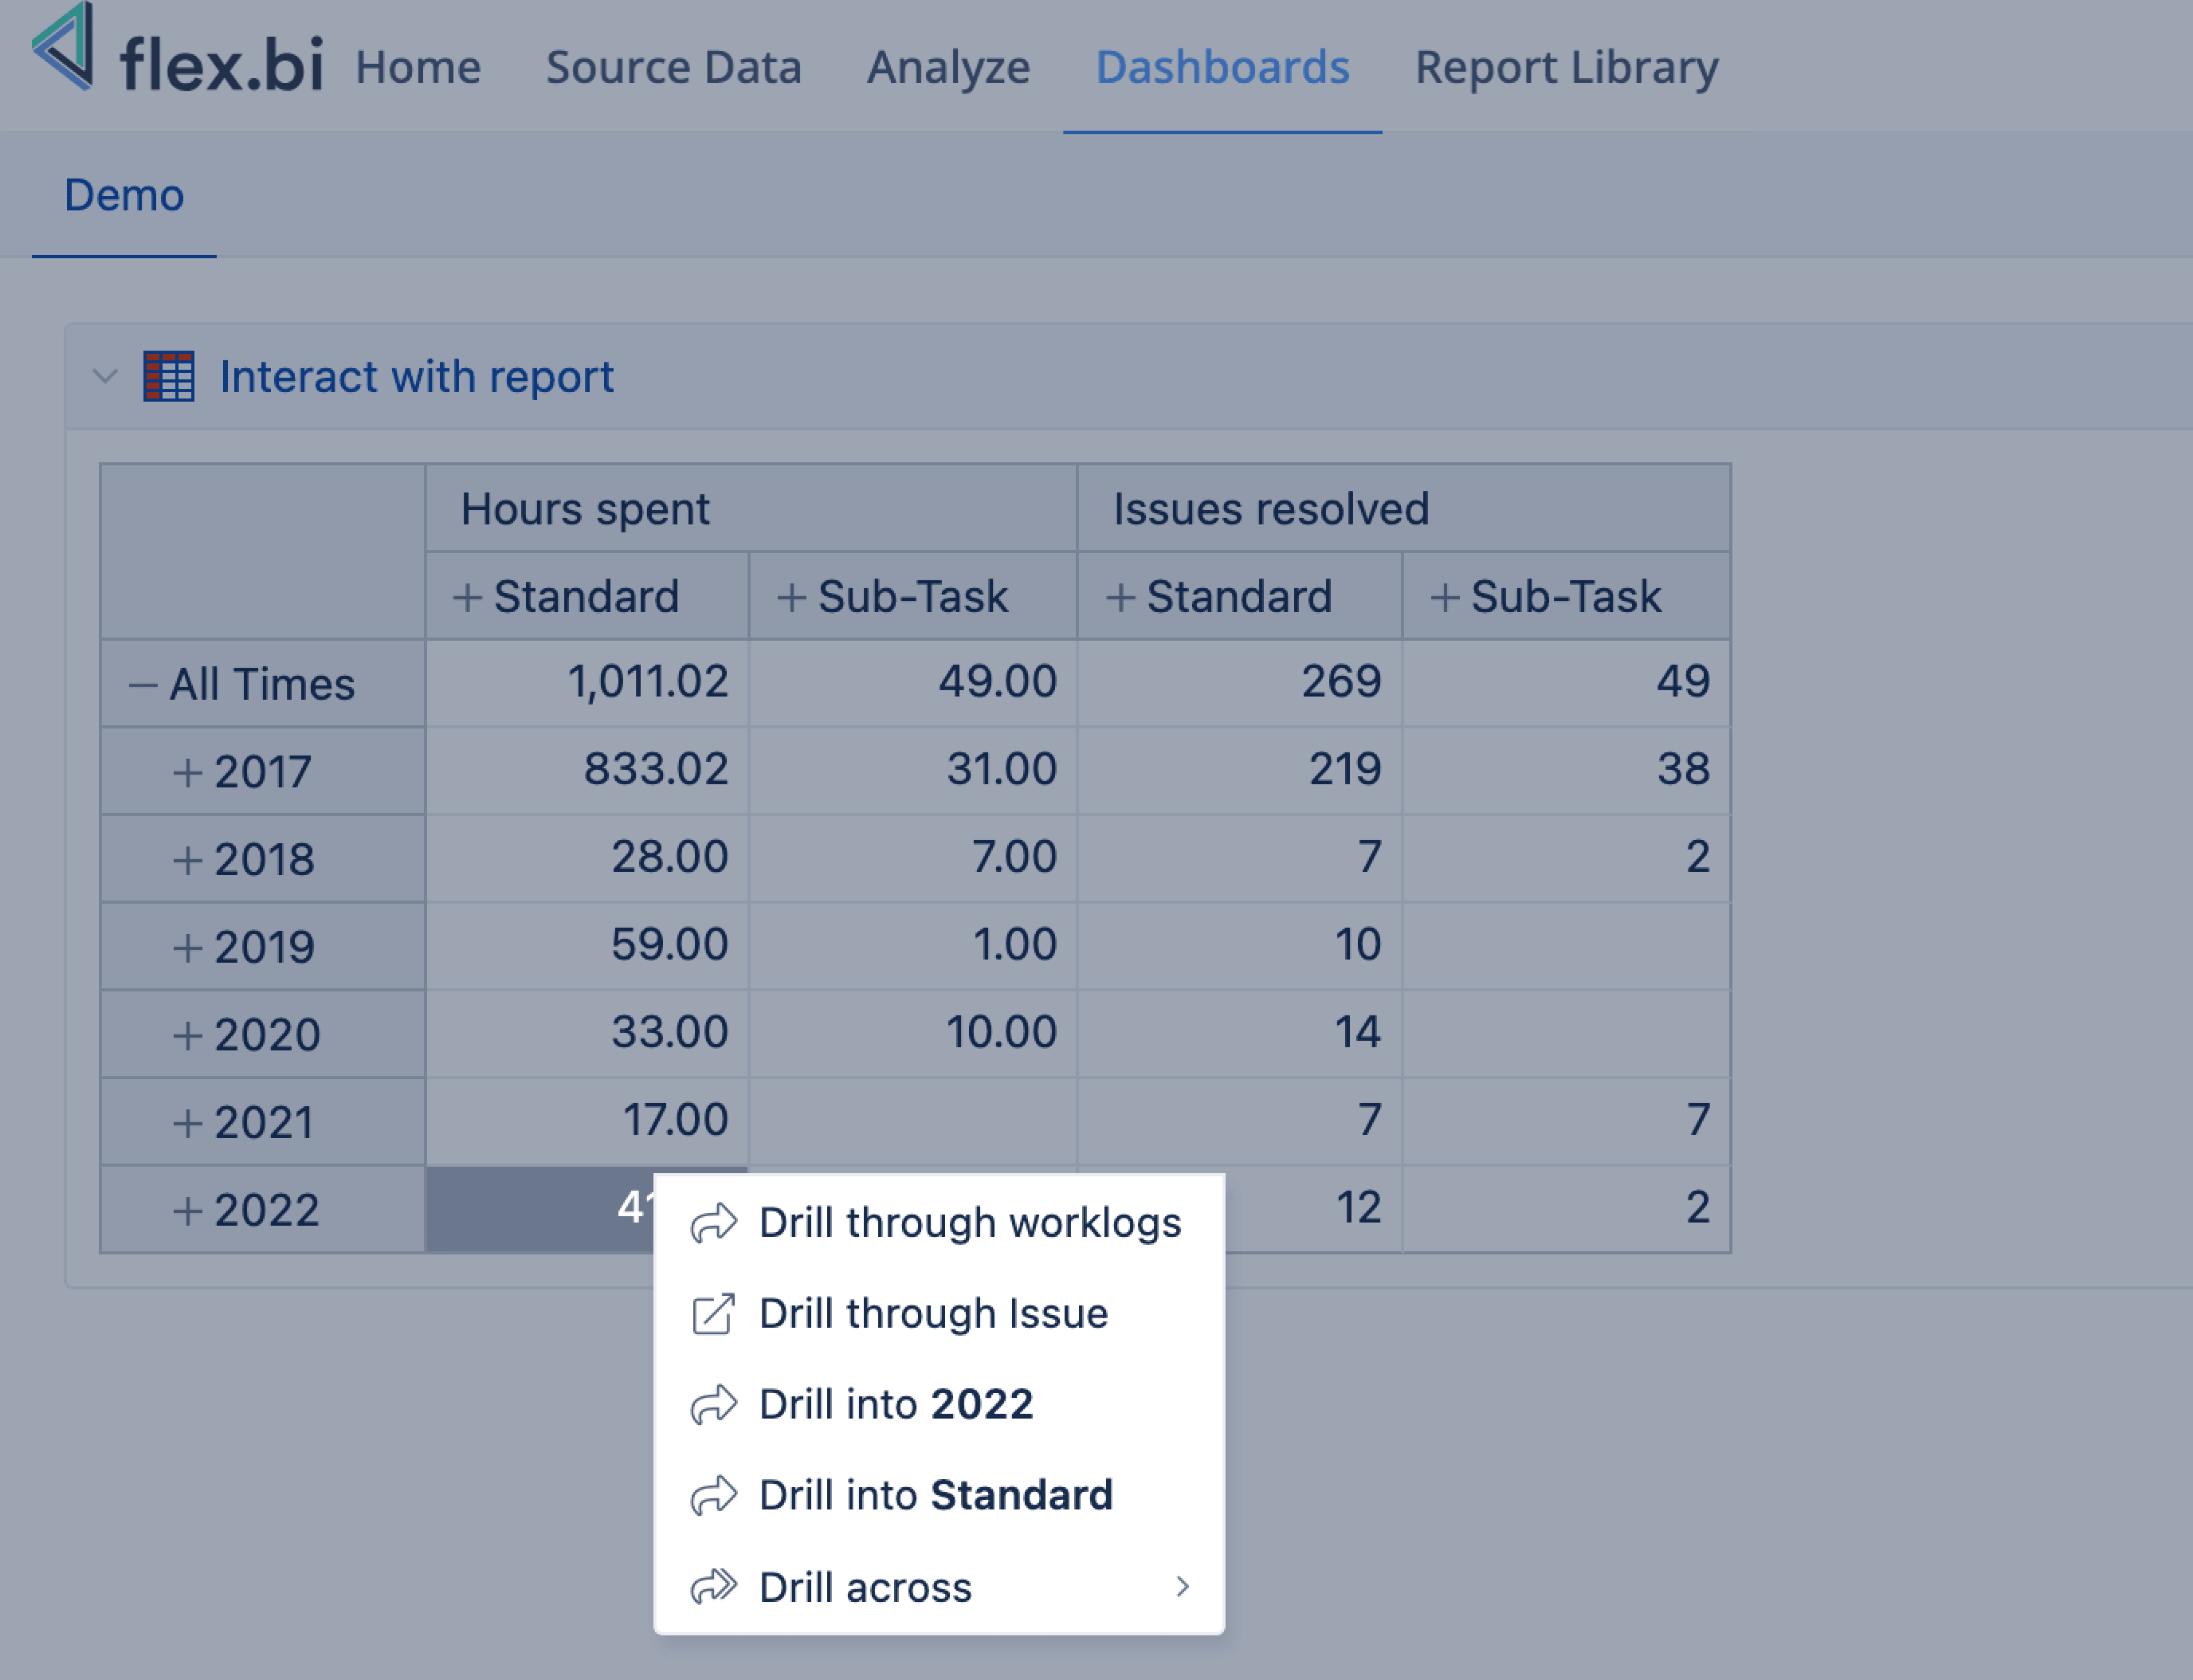
Feel free to interact with the report to explore your data – regroup data, remove columns and rows, order by measure, etc., and when finished, refresh the page to see the published report version. You can go back and forth between different interaction steps using Undo and Redo buttons [1]. Reload the browser to revert back to the original report. You can also export report results [2] to file in CSV, PNG, PDF, or XLS format at any time (available formats may change depending on the report visualization). Click on a measure name [3], a dimension member [4], or a measure value in cell [5] to access different interaction possibilities.
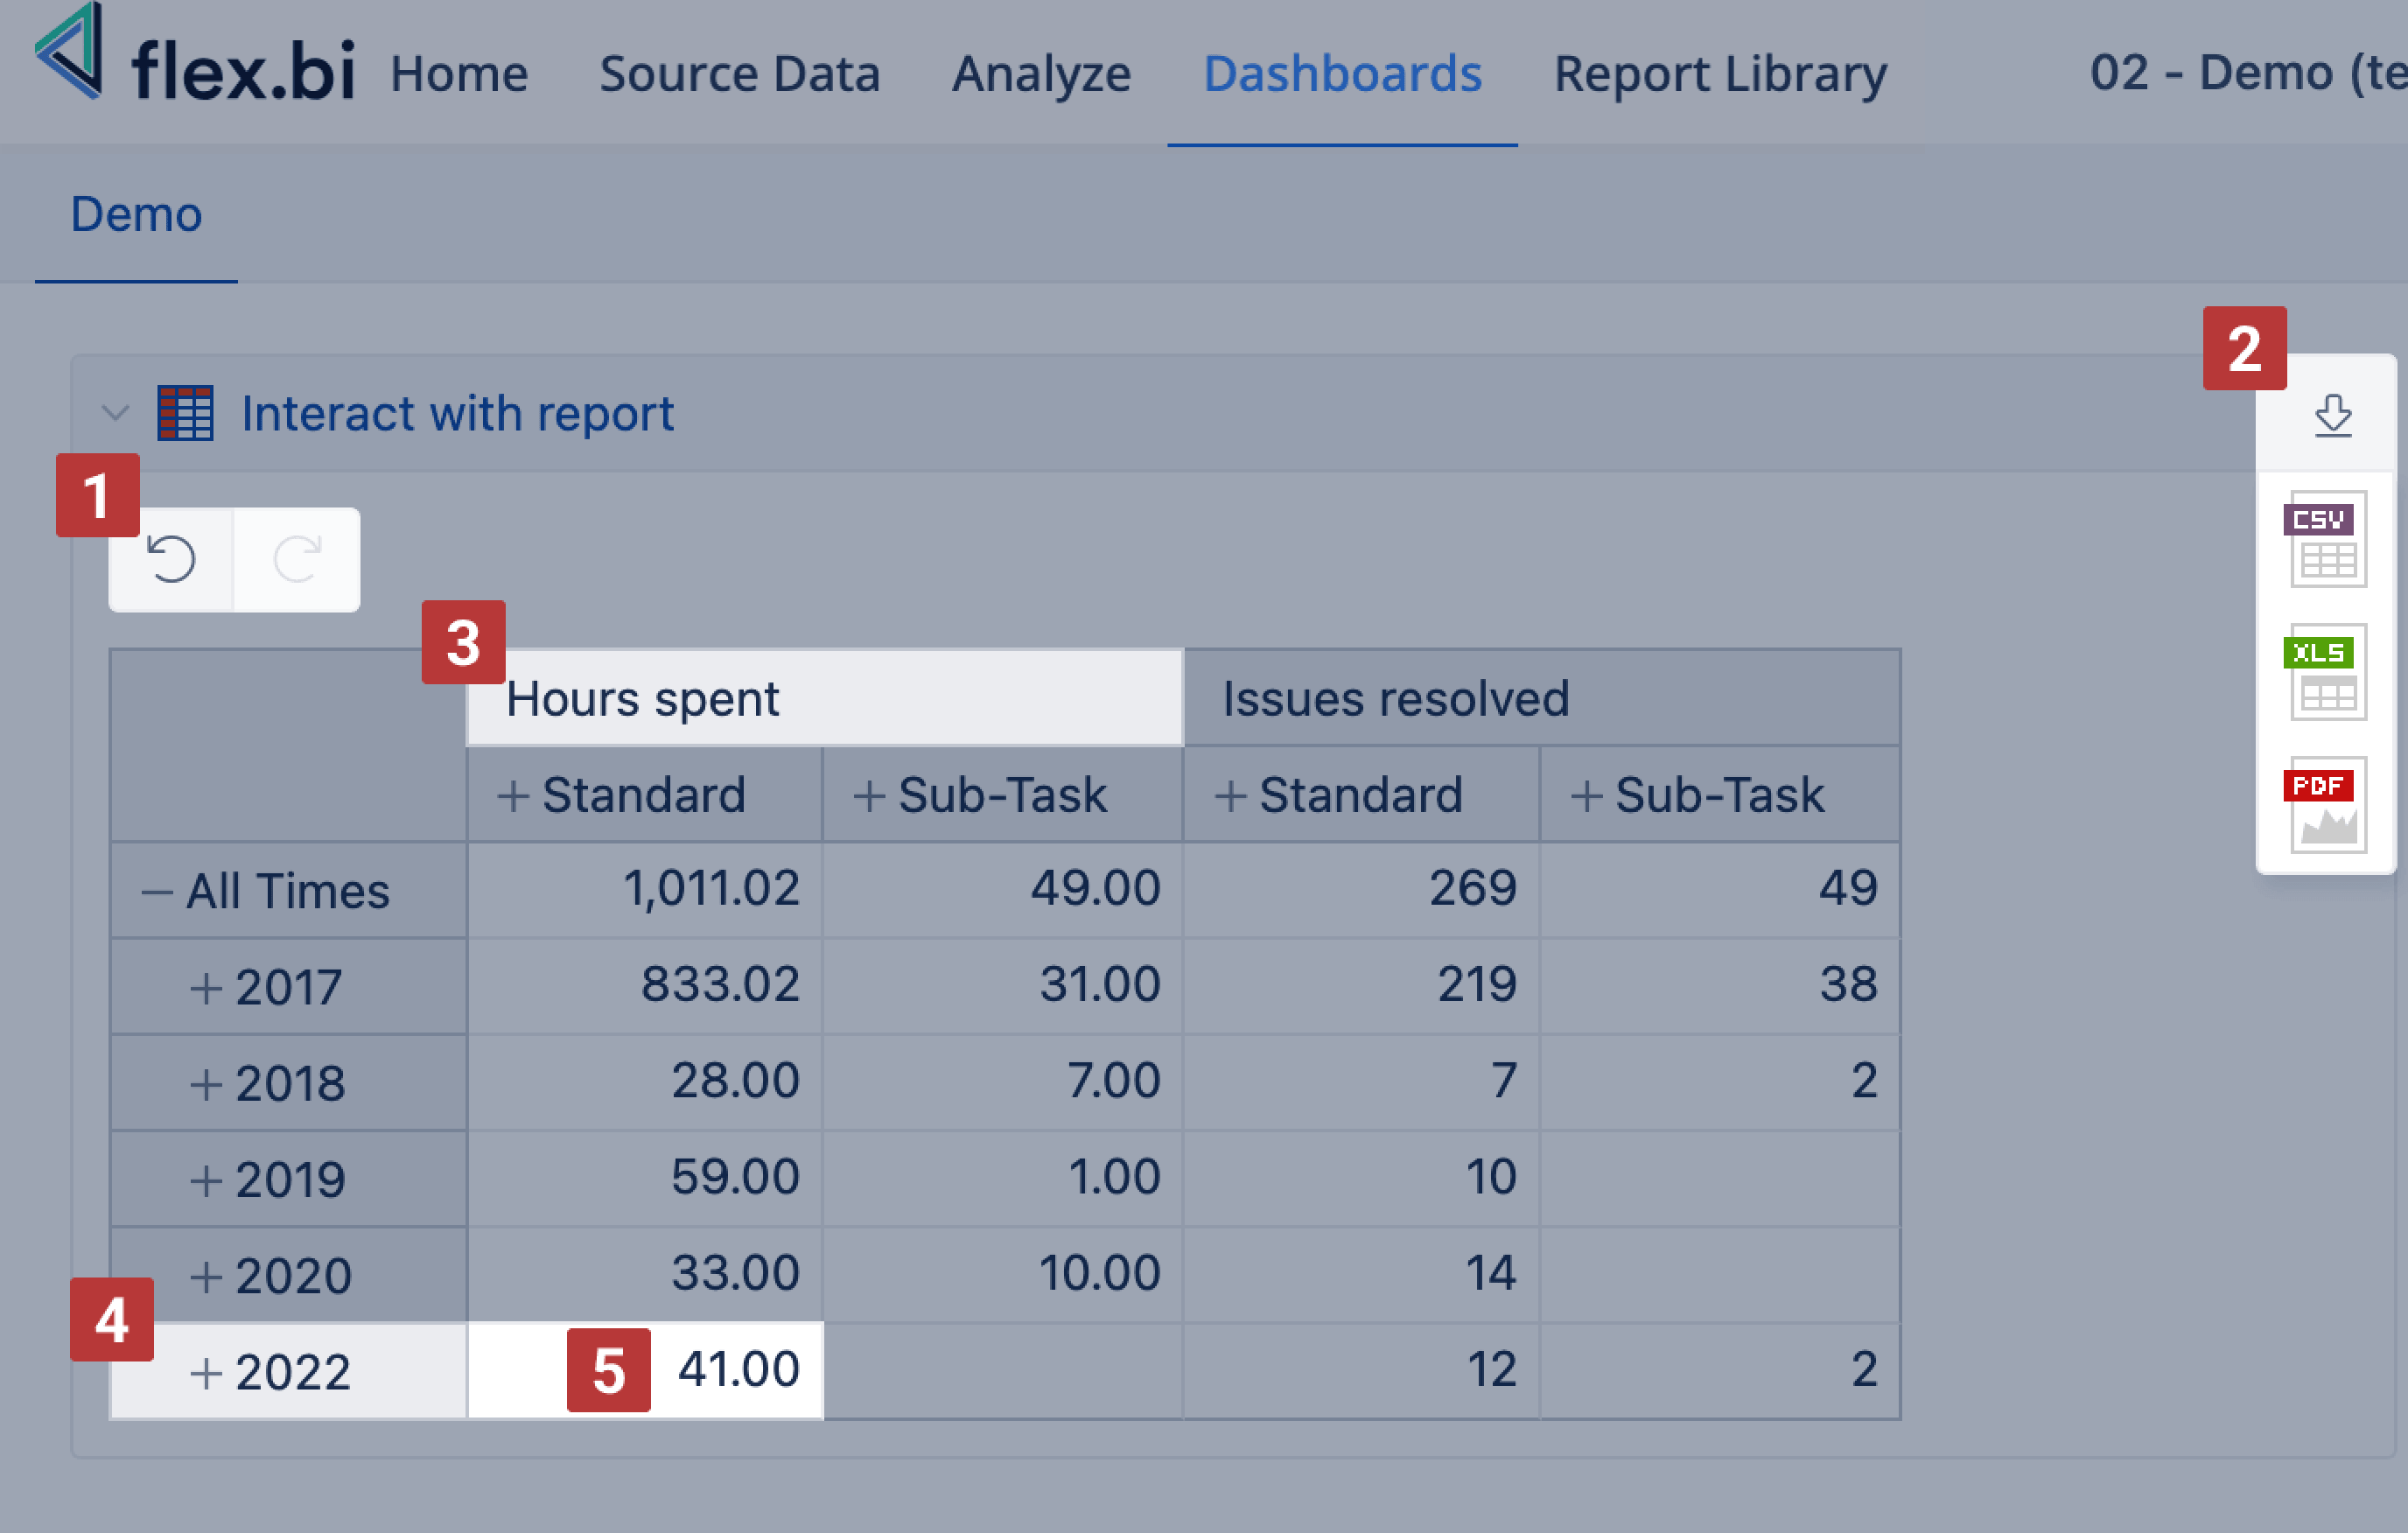
Interact with a measure name
-
Drill into to split measure by another dimension members and see how the measure is grouped by another data layer.
-
Add calculated columns with standard calculations like cumulative sum, average value, linear trend, and more.
-
Select this measure to focus on just one of the measures in the report and remove the rest of the measures (if many were selected).
-
Remove a particular measure from the report.
*Additionally, you can drag the measure to the left or right, if you have more than 1 measure selected in your report.
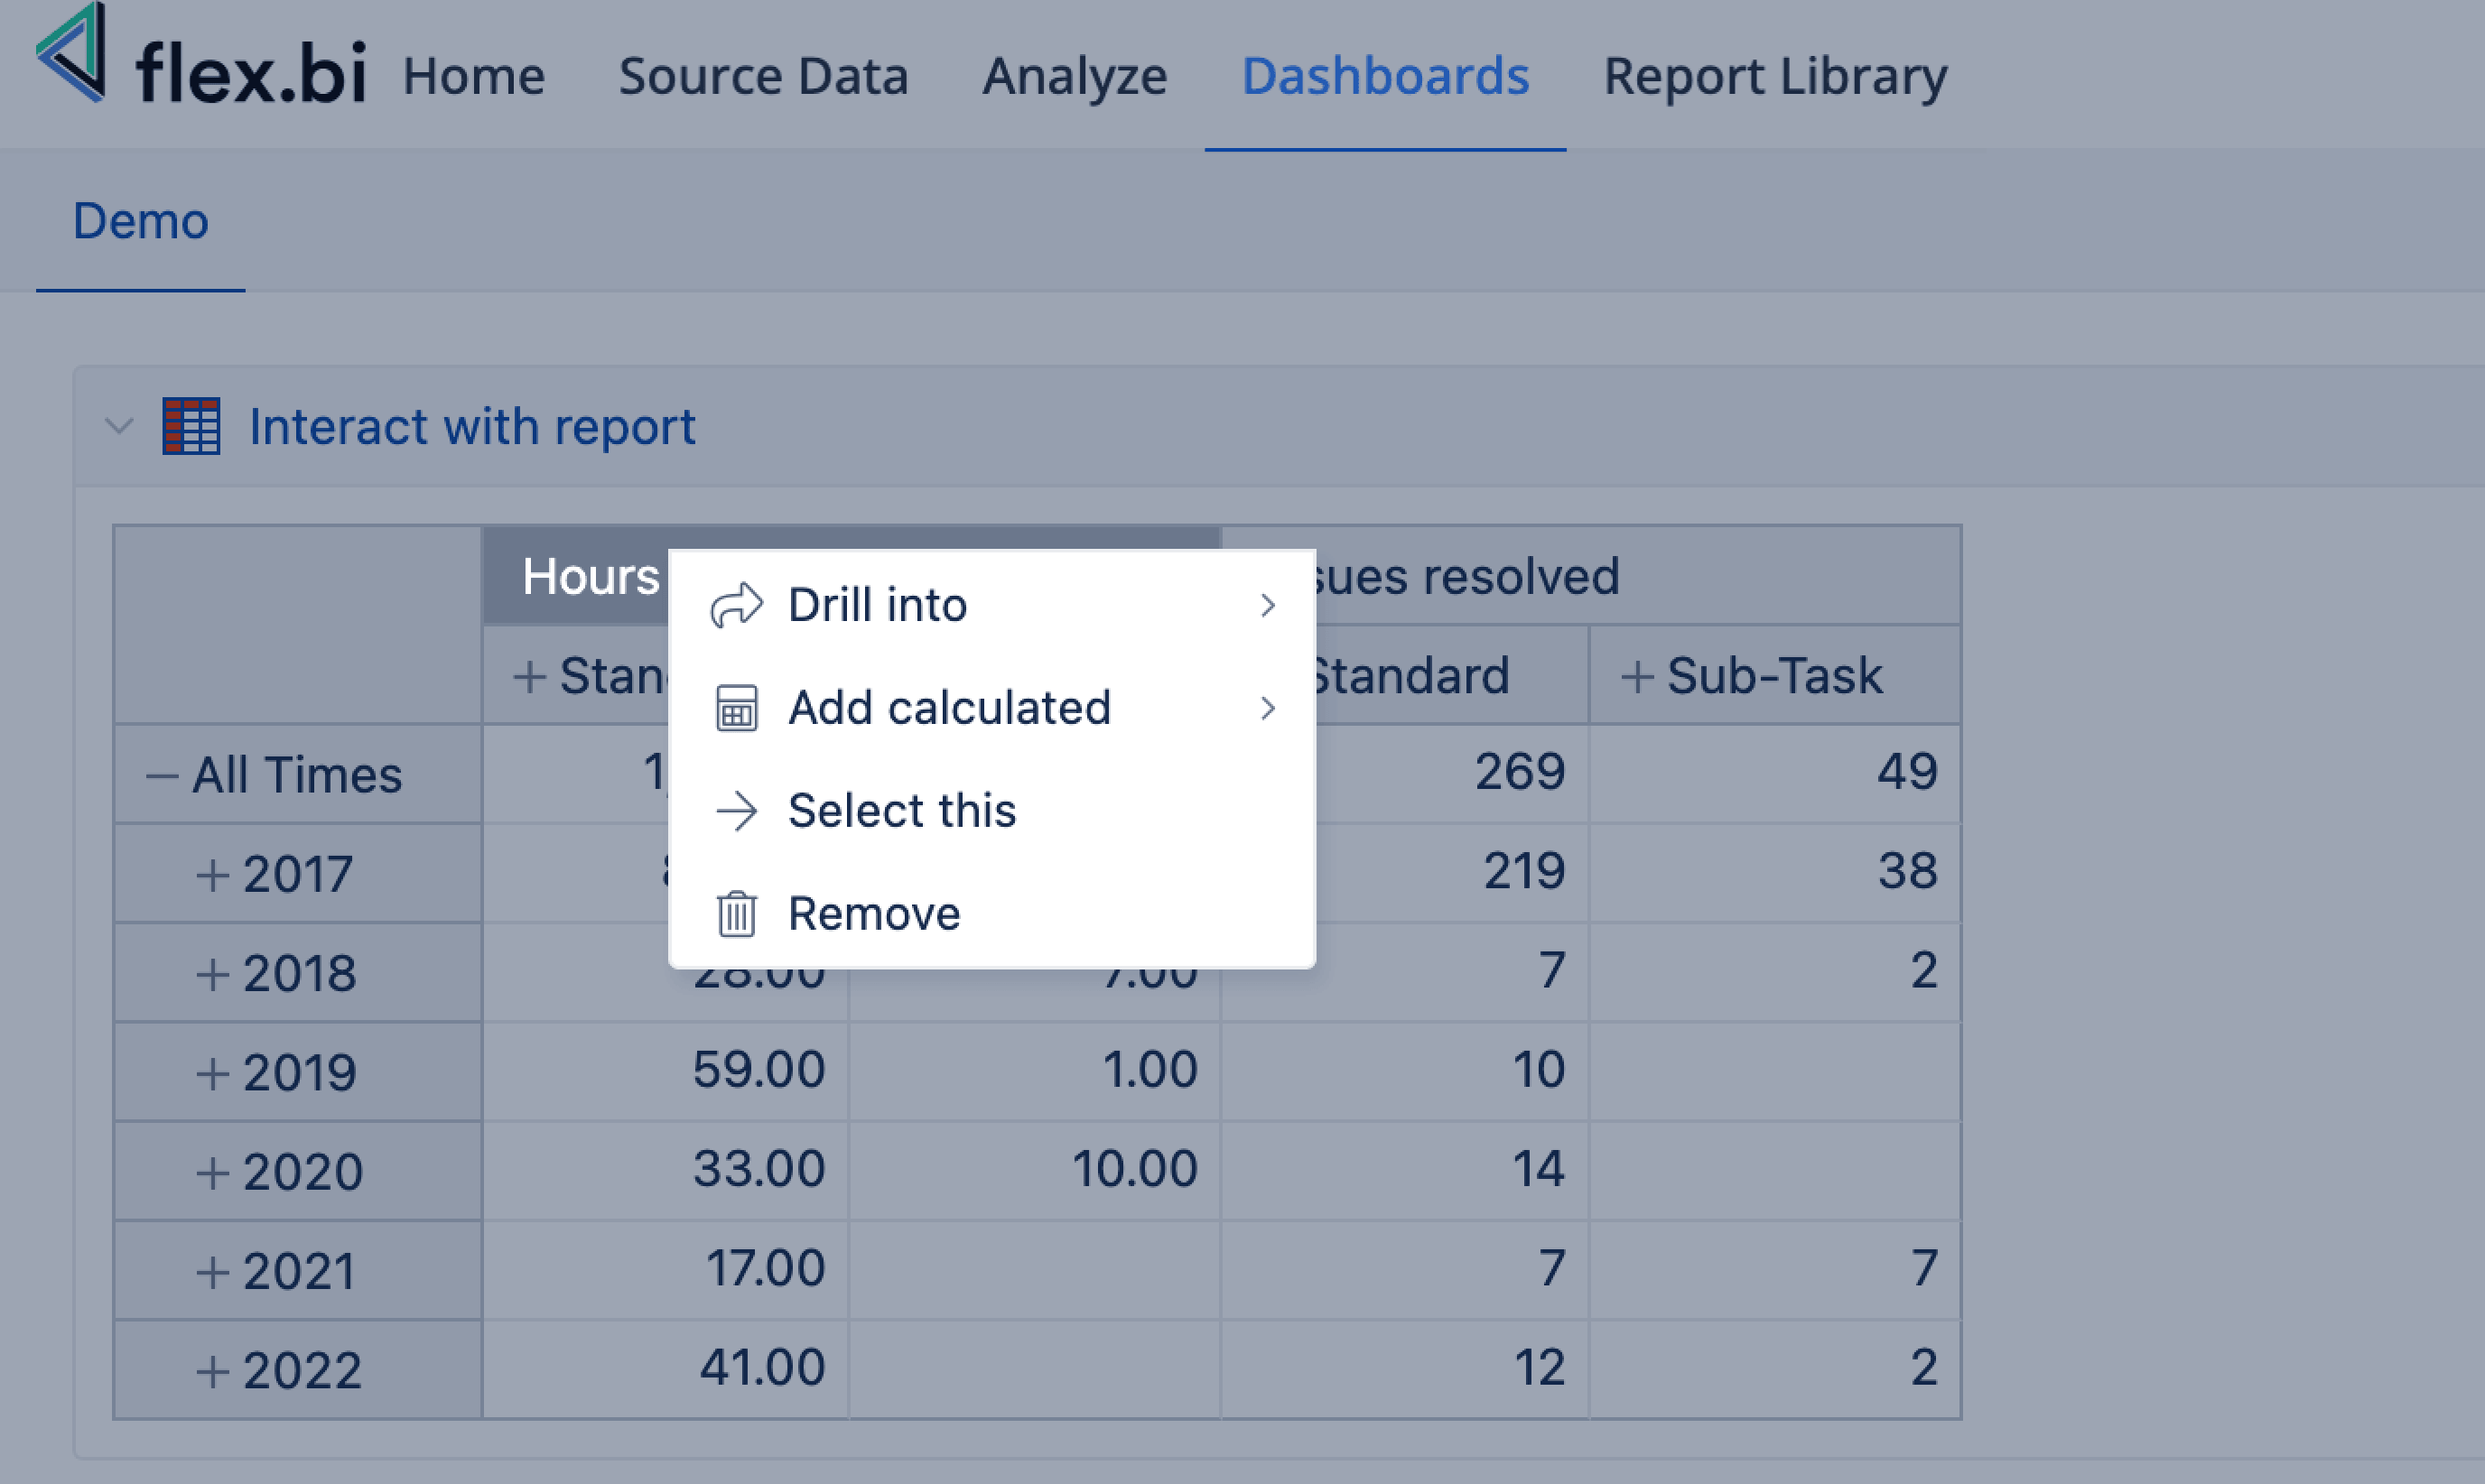
Interact with a dimension member
-
Drill into a dimension member to split all values in more detail (group by next hierarchy level).
-
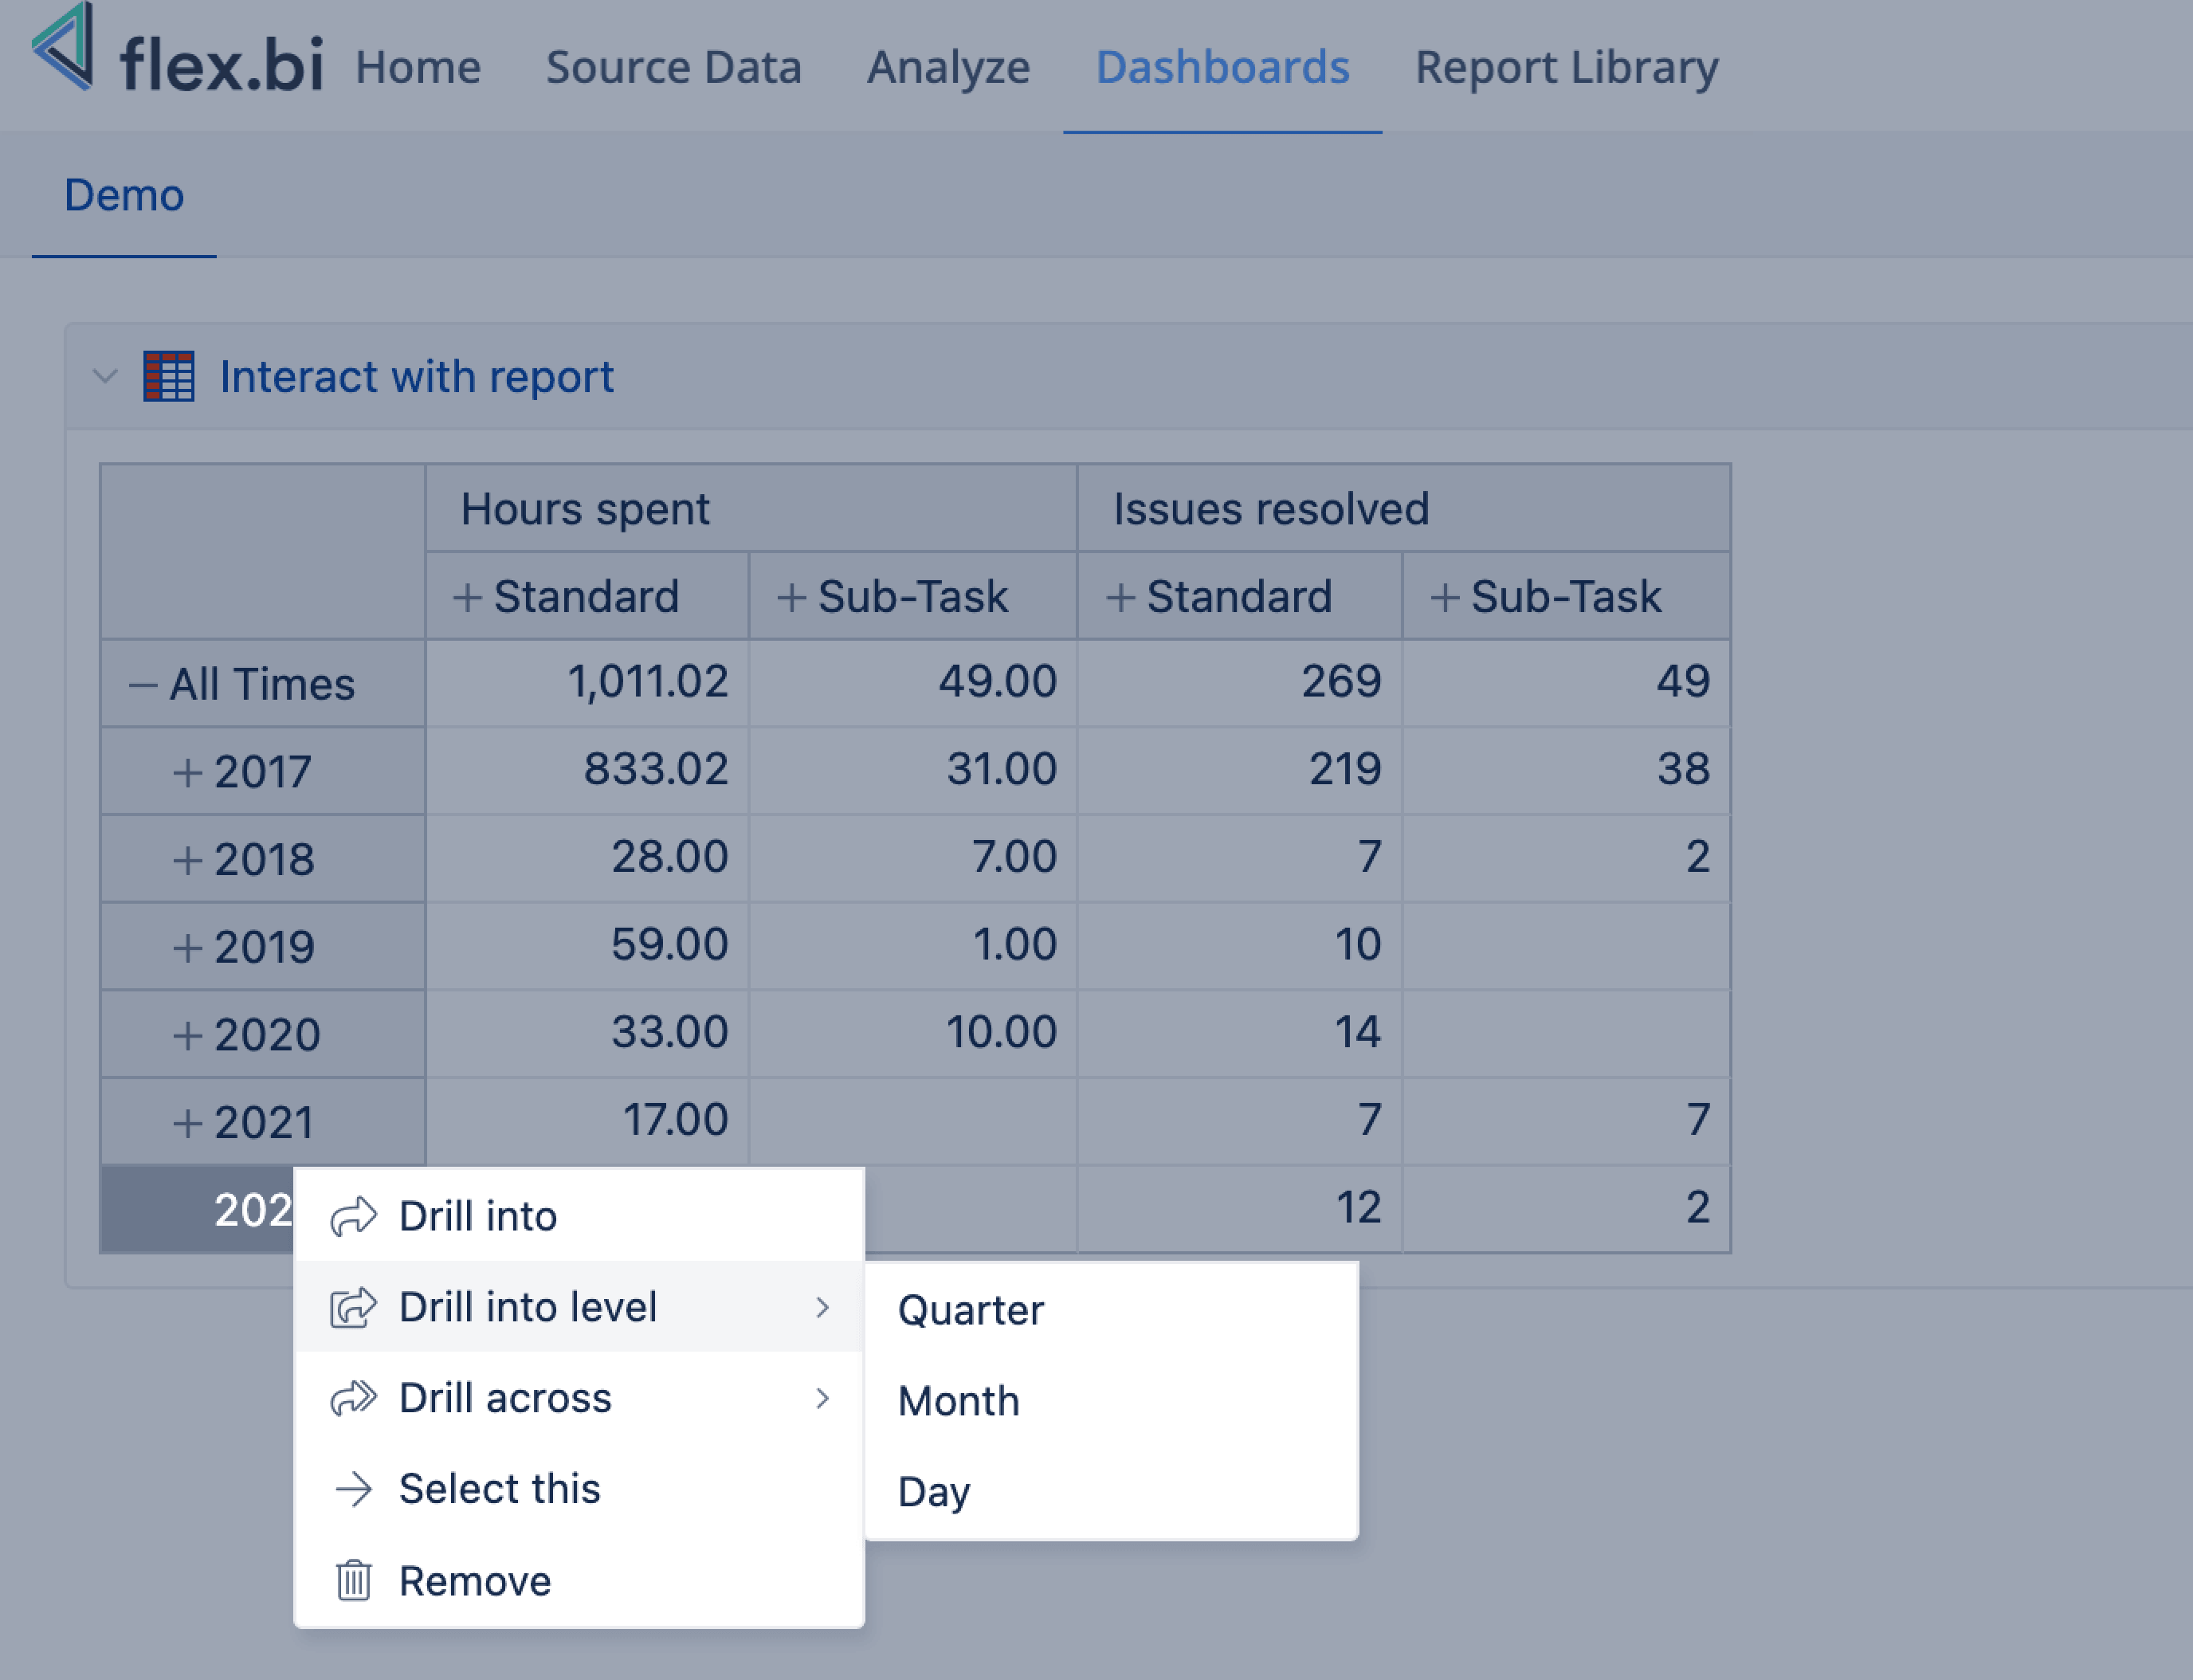
Drill into level of the dimension hierarchy to split all values at the selected hierarchy level.
-
Drill across by another dimension to split all values by selected dimension.
-
Select this member and remove the rest of the members to show all values for this member only.
-
Remove just this member from the report without recalculating other report members.
-
Go to Source to switch to open an object in the source application if the dimension member has a property with an URL.
-
Change the Display name for a limited list of dimensions if the member has the property
DISPLAY_KEYimported.
Additionally, you can click "+" or "-" icons next to the dimension member name to expand/collapse the member if it has any lower hierarchy levels.
Interact with the cell value
You can interact with the report cells representing quantitative values. But this option is not available for properties, calculated measures generating a text and standard calculations for Cumulative sum.
-
Drill across by another dimension to keep just a particular cell value and split by selected dimension.
-
Drill into dimension member to split value in more detail (group by next hierarchy level).
-
Drill through the data source-specific list of objects or events behind the metric.
-
Drill through issue to see a list of issues behind the value with an active hyperlink to Jira issues, if the Issue dimension is not used in the report already. Features are available only when using eazyBI for Jira app.
-
Data from other Jira add-ons also has their specific Drill through lists: Budgety costs and budgets, Asset objects, DevOps pull requests, Qmetry tests and cycles, Xray tests and executions, Zephyr Scale test cases and cycles.
-
Data from Confluence has the Drill though page or task lists.
-
Data from monday.com has the Drill through item list.
-
Data from YouTrack has the Drill through issue list.
-
Data from Zendesk and Freshdesk has the Drill through ticket list.
-
Data from HansaWorld has variety of Drill throughs for each data cube.
-
flex.bi automatically calculates the optimal size of the list and displays Drilled trough data into portions, if necessary. For large lists, use the selector at the bottom of the screen to switch between portions. You can use this feature to open all issues from the view in the Jira issue navigator.
The result of this feature would be a list of Drilled trough data on an additional pop-up screen. The columns of this view can be customized by adding measures and properties as additional columns; click on the plus icon on the right of the last column header. Save the report to keep the customized view in this report; the drill-through issue screen is not affected when interacting with other reports.
-
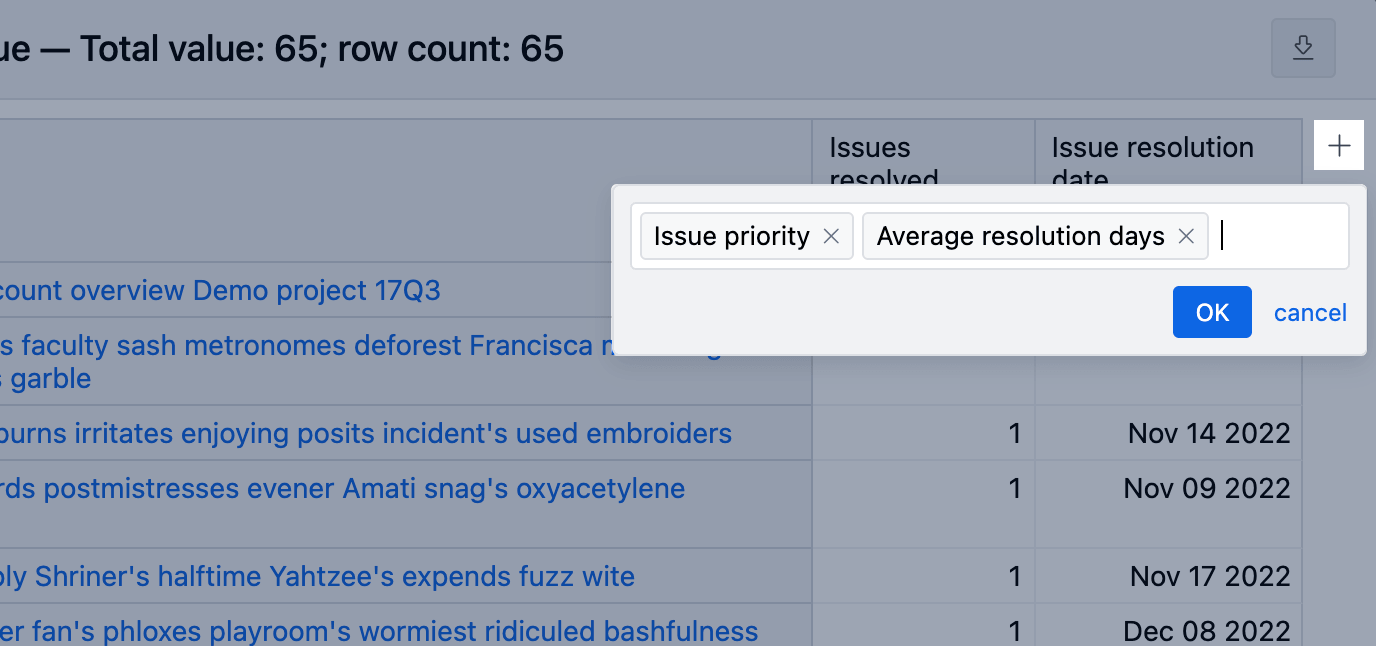
Detailed list of entries with a predefined set of columns with available information.
-
Detailed list of worklogs for the Hours spent, shows Jira worklog entries with details on date, issue key, person, comment, and hours. Features are available only when using eazyBI for Jira app.
-
Data from other Jira add-ons also has their specific Detailed list of add-on specific data: Budgety worklogs, DevOps pull requests, Qmetry executions, Xray test executions, Zephyr Scale executions.
-
Data from YouTrack has the Detailed list of work items for the hours spent measure.
-
Data from monday.com has the Detailed list of worklogs for the hours spent measure.
-
Data from Harvest has the Detailed data rows.
-
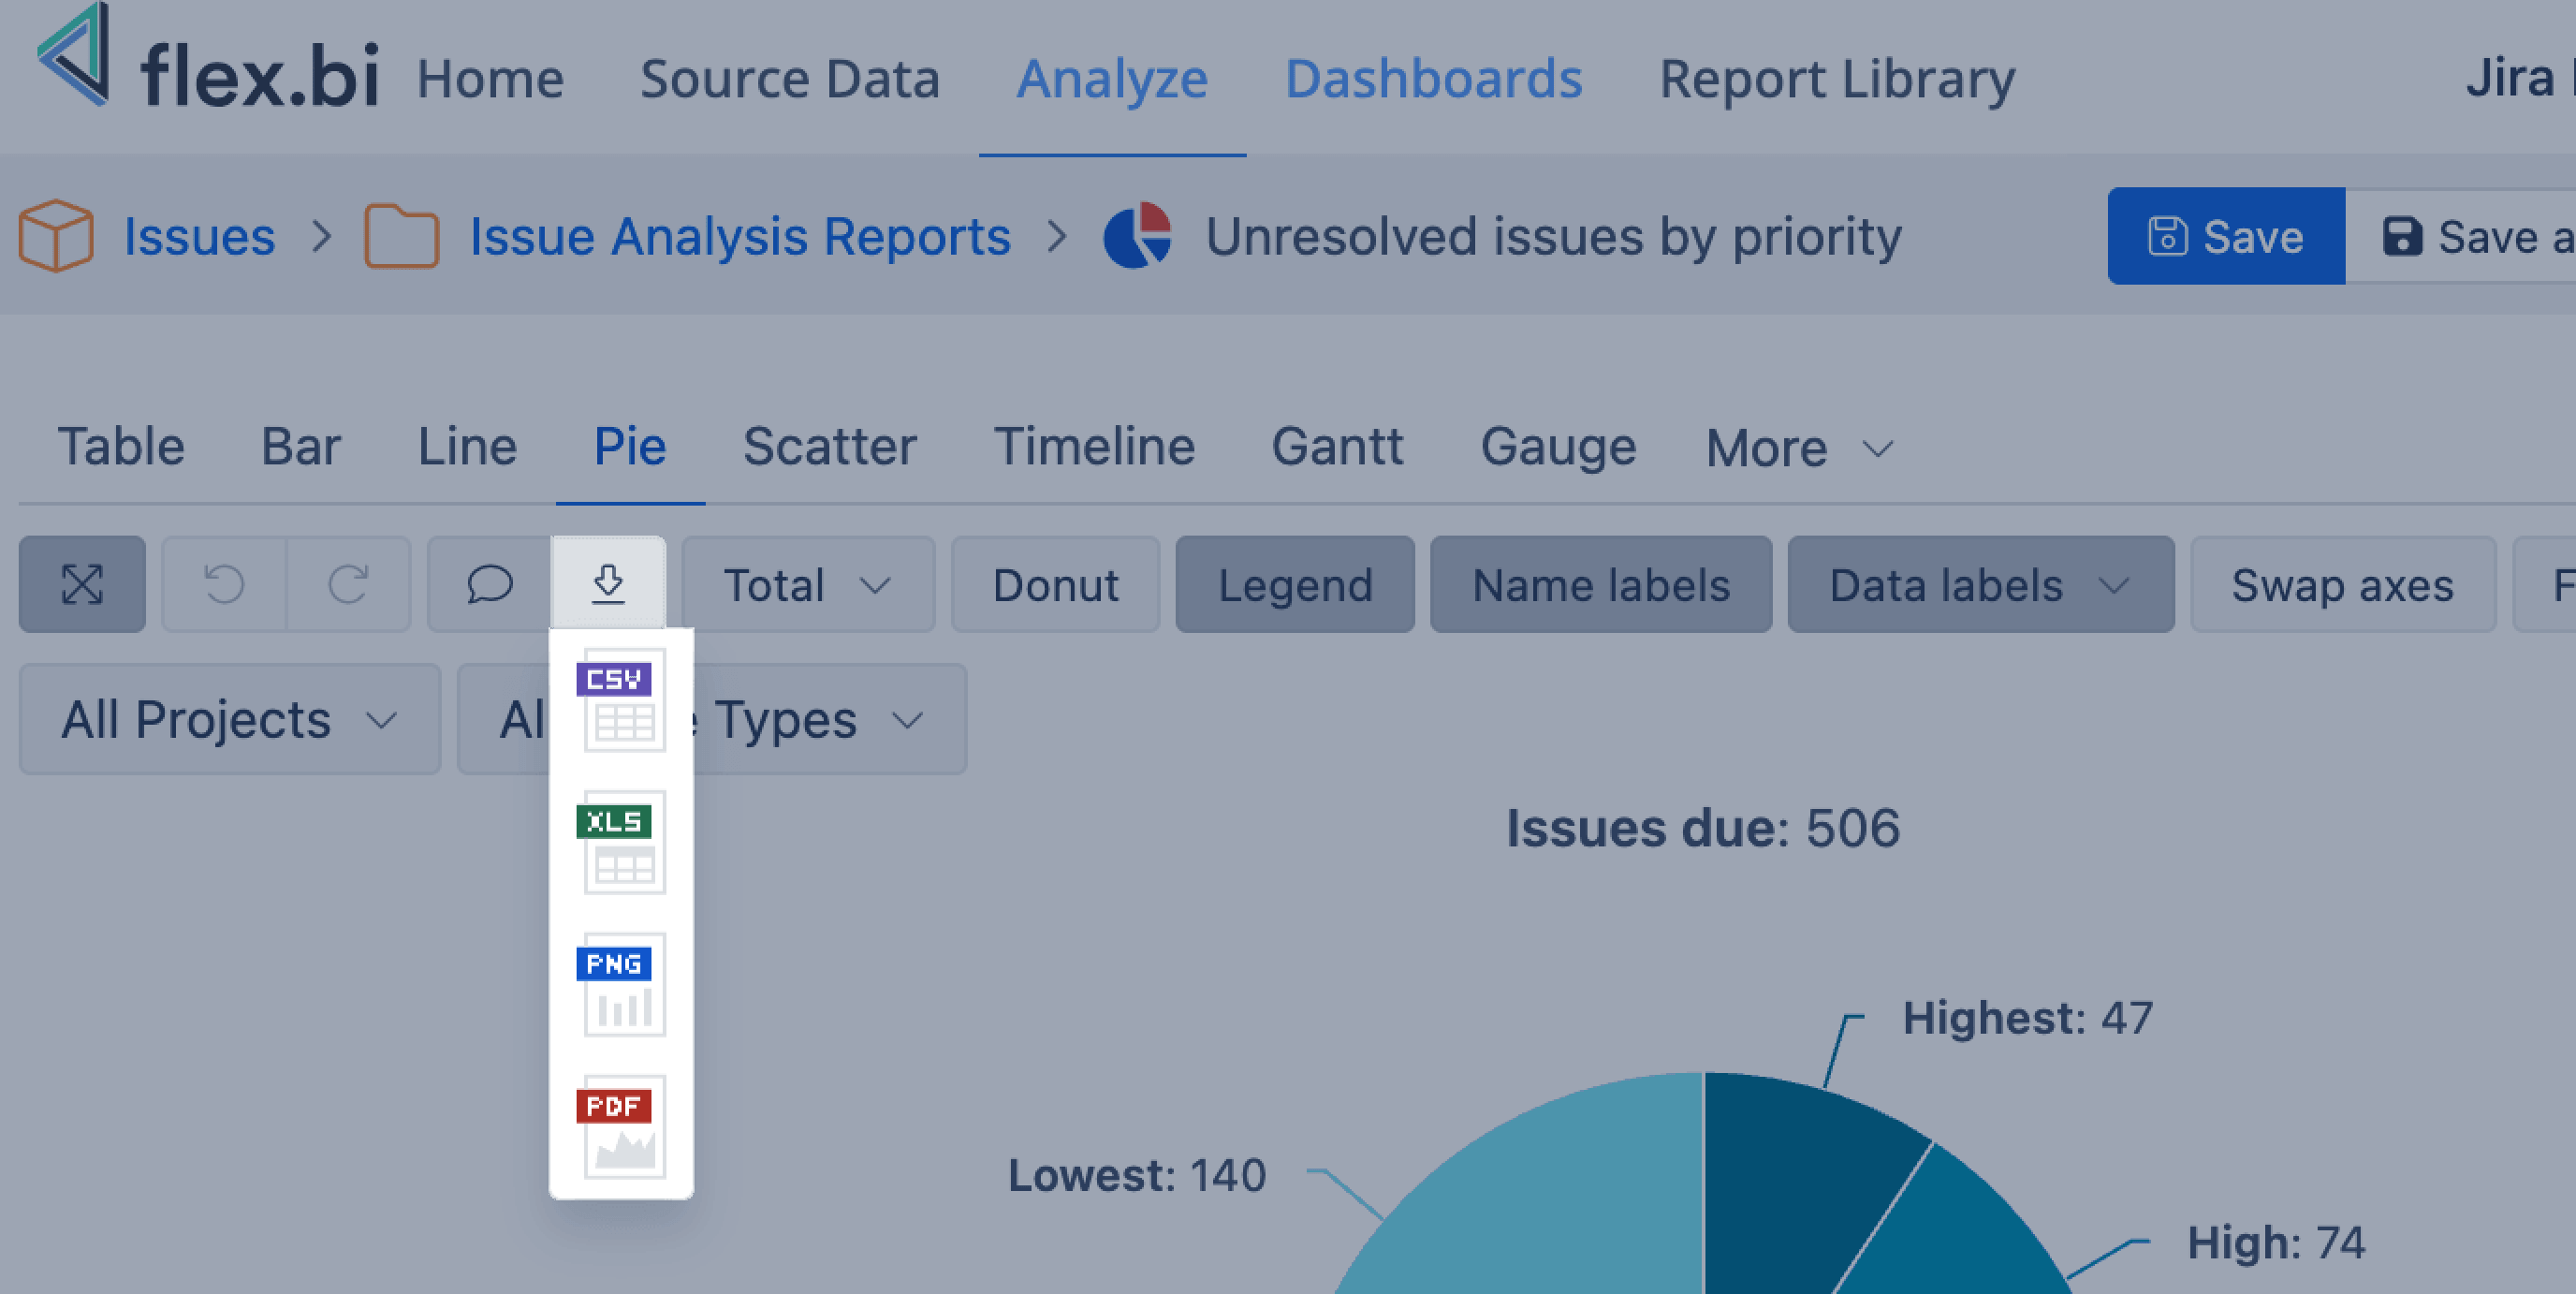
Export report results
You can download report results in CSV, PNG, PDF, or XLS format using the export report results button on the toolbar. Available formats vary depending on the report visualization.
-
PNG and PDF formats export the report as it appears on screen. PNG format is not available for Table and Gantt charts.
-
XLS format exports the report data in a table view without conditional cell or Markdown formatting
-
CSV format has data separated by commas with default formatting for fields.
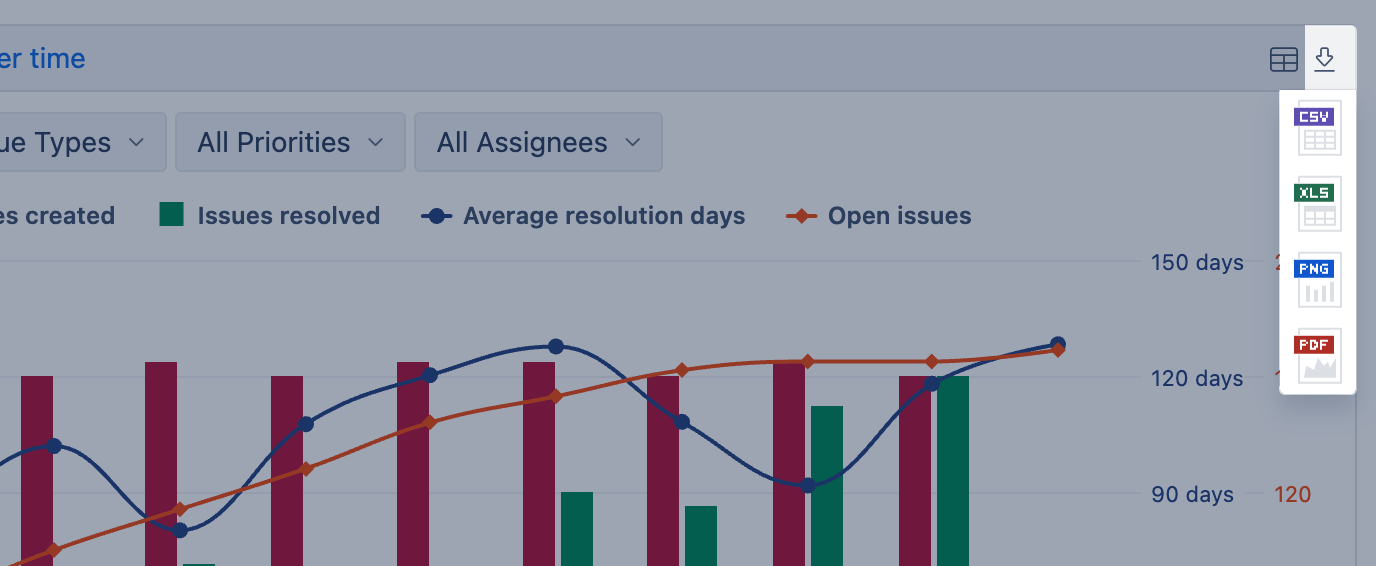
When a report is published on the flex.bi dashboard, the download button appears in the top-right corner of the report frame.
It is also possible to download the whole flex.bi dashboard to PDF or subscribe to receive the PDF in email
If needed, the user can run and export report results using the report results export API.
However, we advocate using reports online in flex.bi or other places where you can publish them.
PDF options for report
flex.bi automatically determines the best fit when exporting a report to PDF. For the Table, Gantt, and Gauge charts, you can override the defaults in the PDF options dialog. Table and Gantt chart reports, in particular, can become very wide or long.
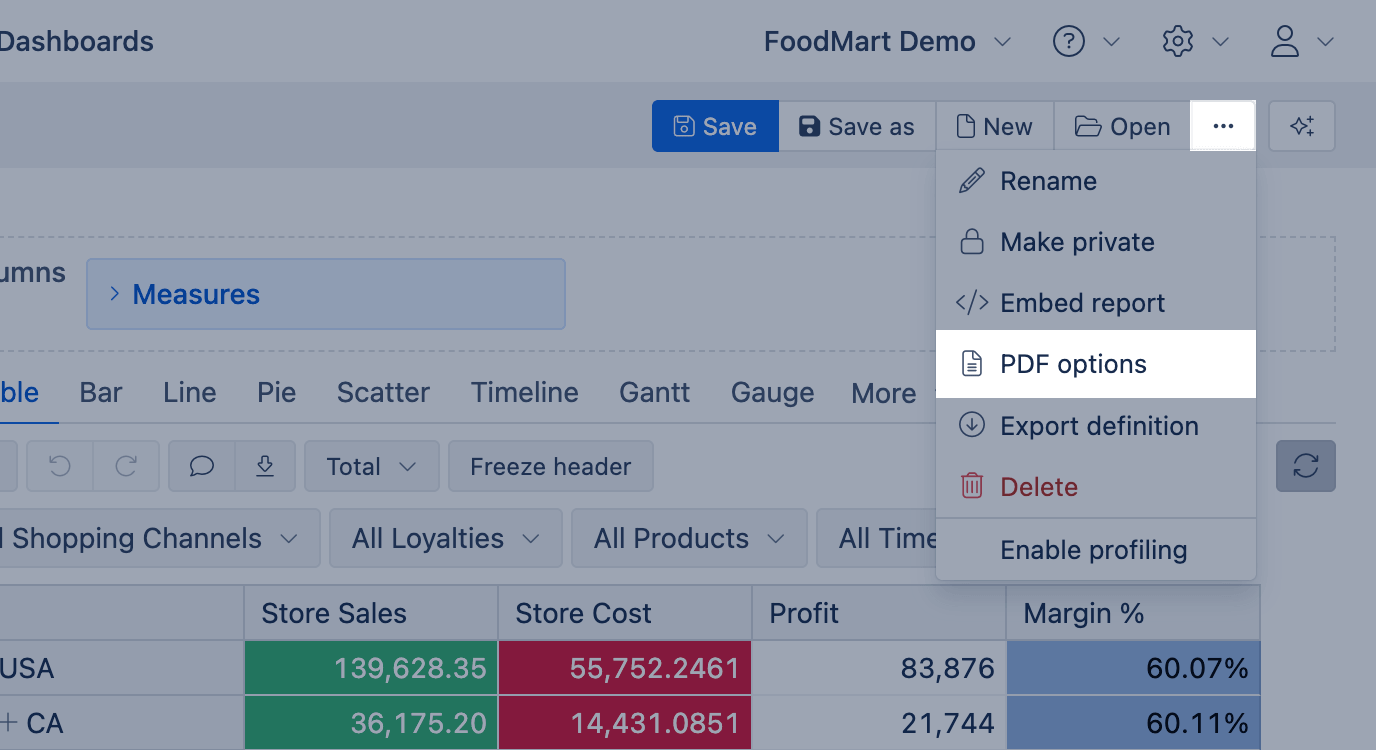
Click the More actions (the three-dot menu) in the report toolbar and select PDF options. This option is available to users who can edit the report and save the changes. Settings are saved per report.
The PDF options let you control the page format, orientation, and margins used when exporting a report to PDF. When choosing the fit to content width format for a Table or Gantt chart, the page width is dynamically sized to match the full width of the report content.
Use AI assistants to explain the report
In flex.bi, you can use report builder assistant to explain the report - it gives a short summary of the report and the meaning of measures but will not see your data.