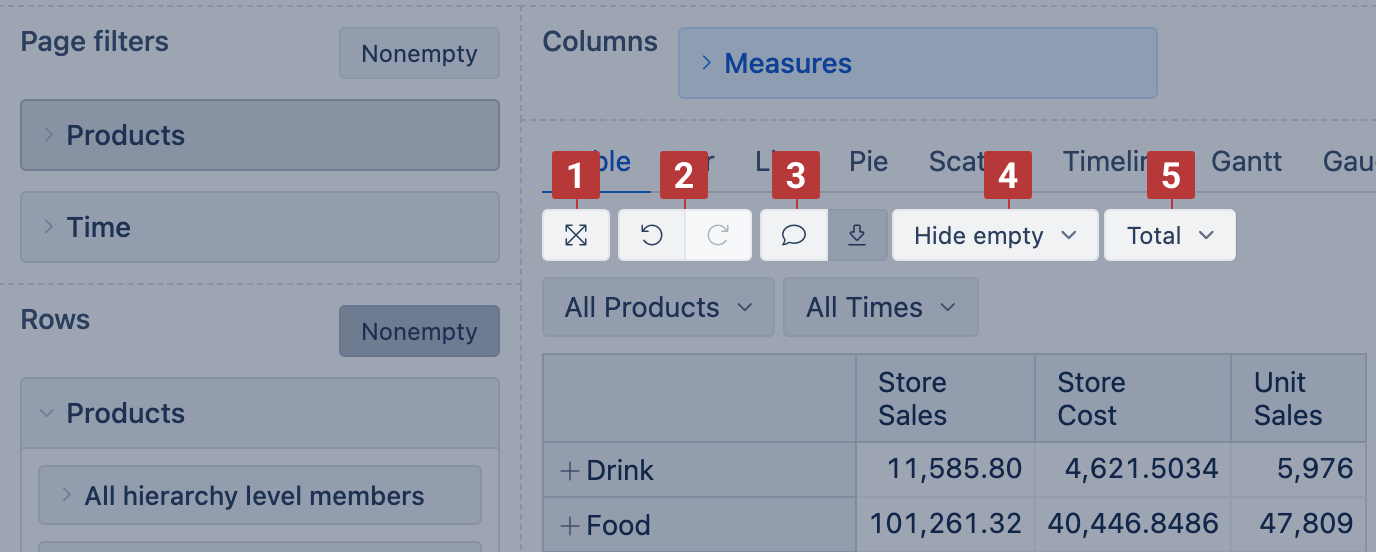
You can try out some options for report result configuration in the report results toolbar - maximize report area [1], undo & redo buttons [2] as well as adding report description [3], and hide empty rows and columns without values [4]. You can add the bottom row and far-right column with the aggregated Total value [5].
Undo and redo changes
While editing the report, do not be afraid to make changes. Before saving, you can undo or reduce the last changes before saving the report.
Report description
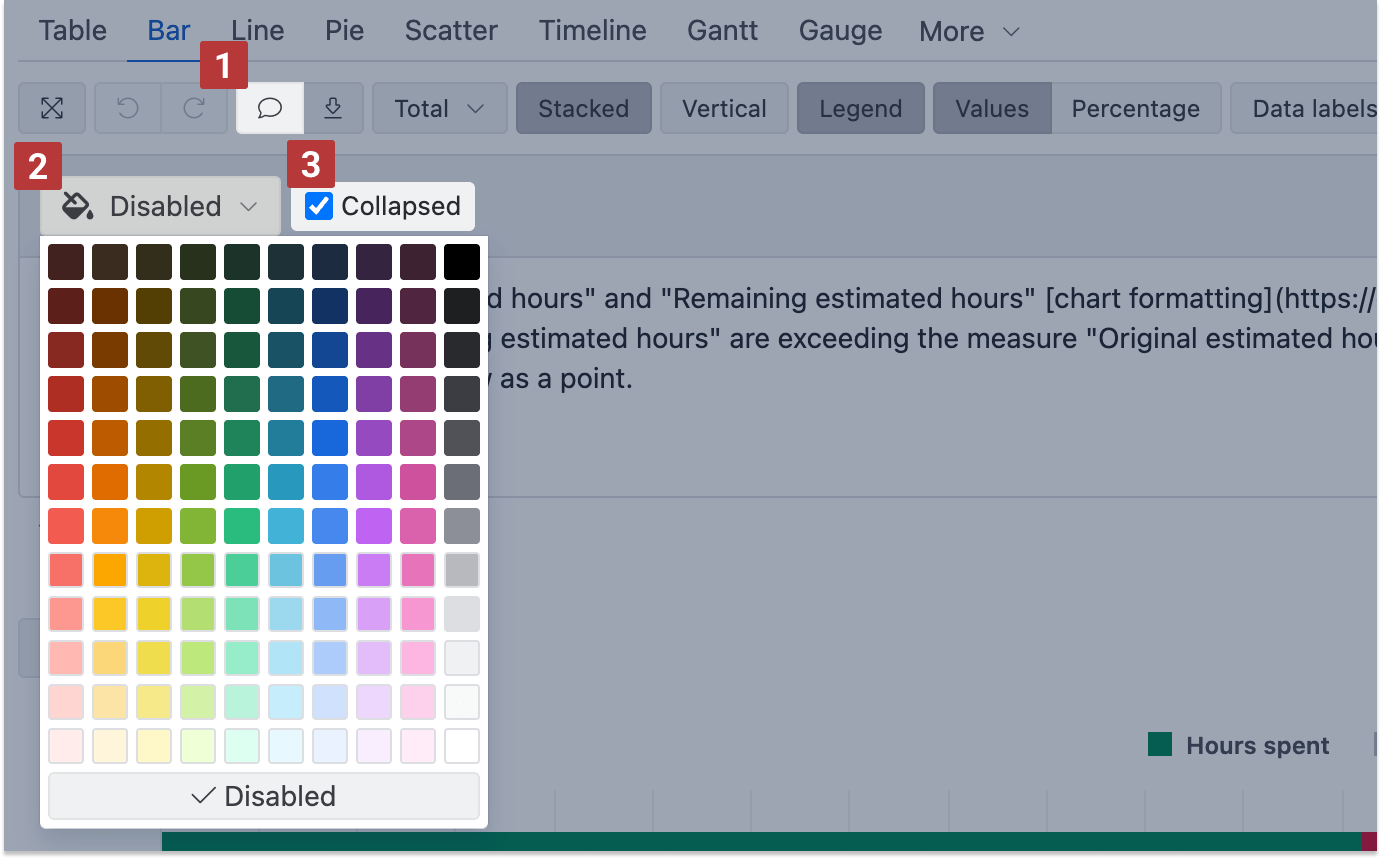
In the report, click Add description (or click the existing description) to open the description editor [1]. You can write the description as plain text, markdown, or HTML, for example, to explain what the report shows and how to read it.
In the editor, you can adjust how the description looks:
-
Click the background color icon [2] to select a background from theme colors that adapt to the light or dark theme. By default, the description has no background color.
-
Select the Collapsed checkbox [3] to show the description collapsed when the report is opened; readers can expand it with the collapse icon at the left edge of the description.
Click Apply to close the editor, and then save the report.
The report description is also displayed with the report on dashboards.
Total and sub-total
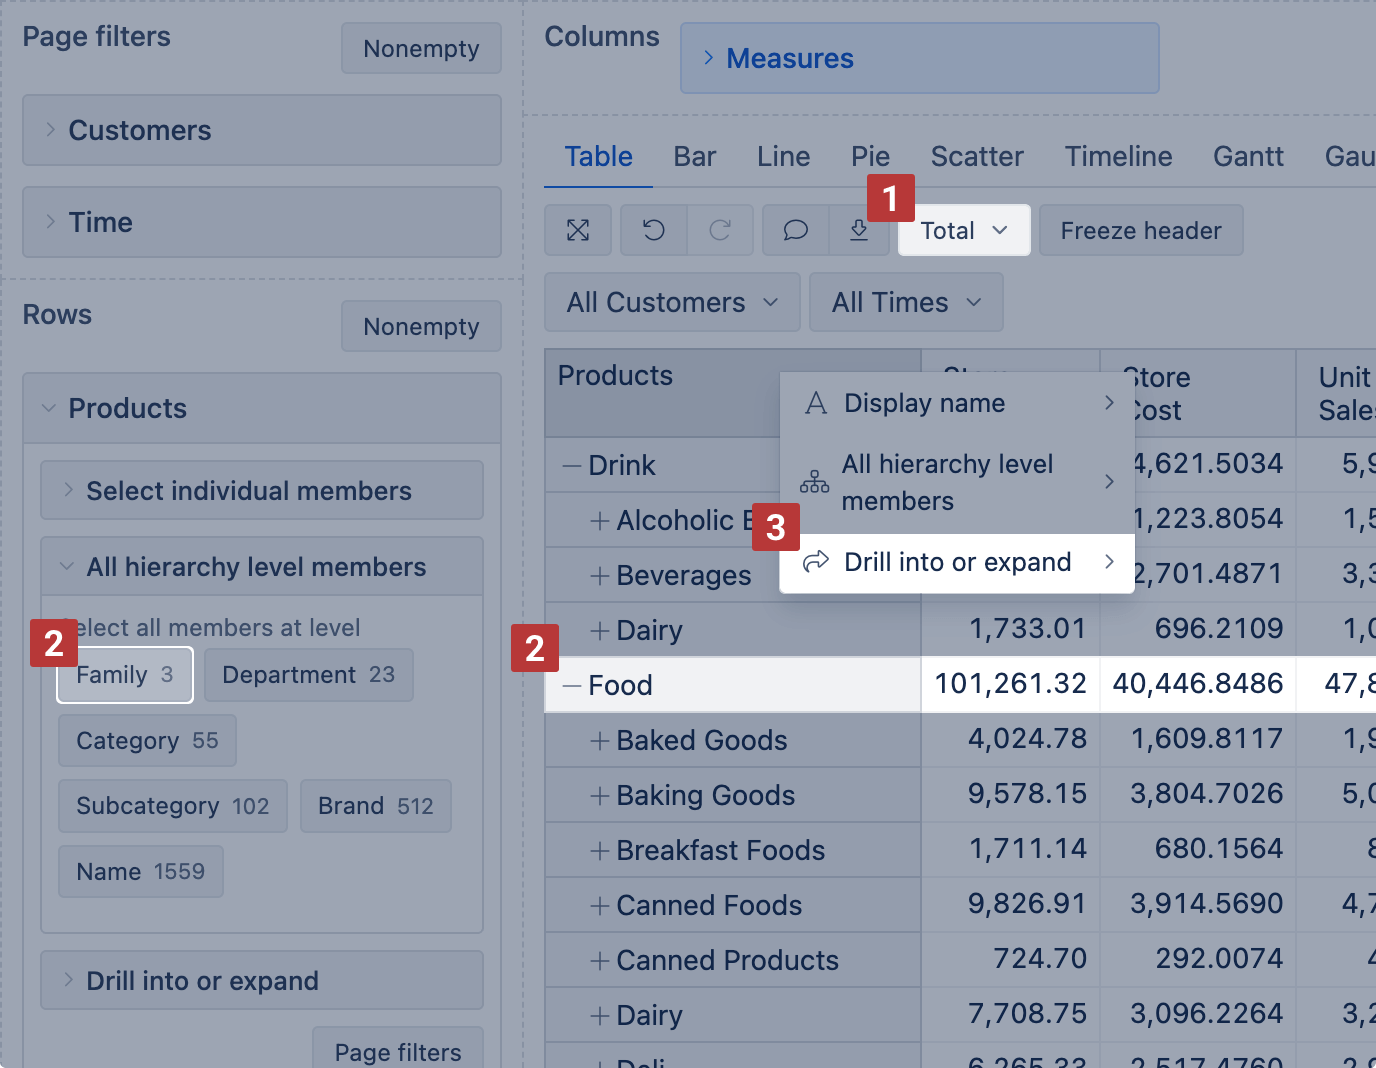
You can use the Total [1] feature to quickly get the aggregated results of rows and columns at the bottom (for rows) and in the last column (for columns). In most cases, this will do the job. However, some measures are more complex and represent calculated values (like average, max, conditional statements, or specific properties), so you might need to force the Total row behavior with annotation in the formula editor to calculate the sum of results.
If you expect other functions but Sum, we recommend using hierarchy levels or calculated members to get total or sub-total values [2] for the particular calculation. You can expand [3] the hierarchy levels and see results calculated at each row.
Change row dimension headers
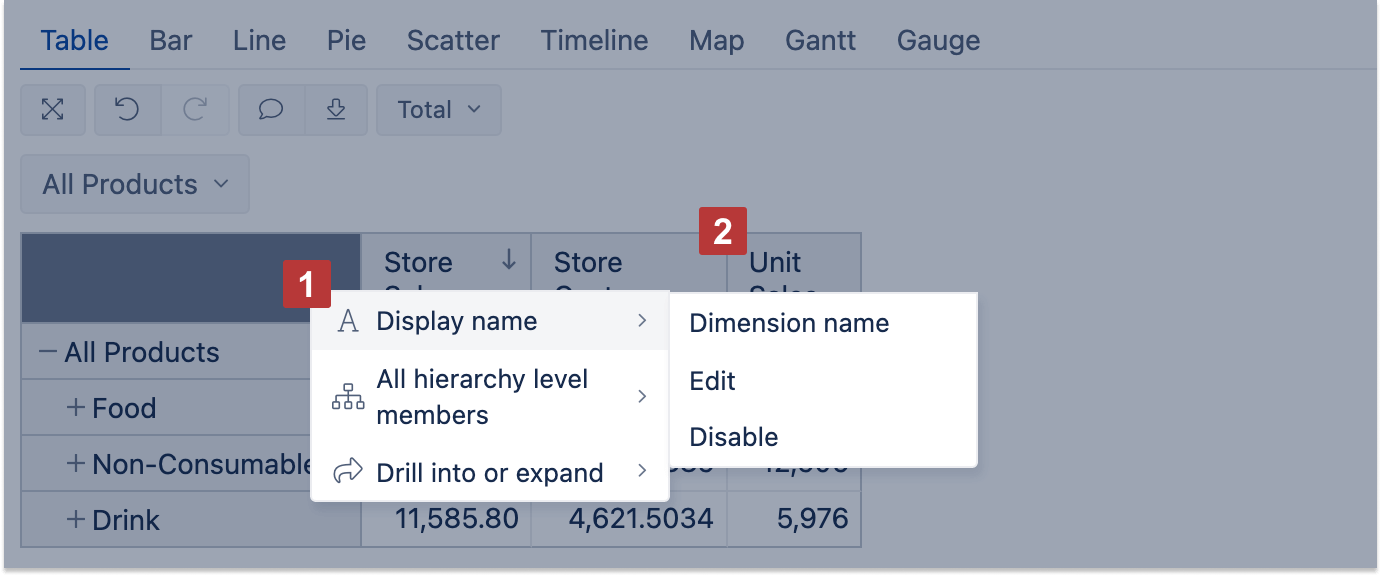
You may add or change a header on columns containing row dimension members [1]. Choose to display the dimension name as a header, or edit and enter a custom display text.
Headers of measures can't be changed from the report view [2]. You may change the name of the measure itself (it would affect all reports where the measure is used) or create a new measure (or calculated member for other dimensions) with the needed name and then use it instead of originally selected.
Vertical column headers
It is possible to change the table report to show the column headers vertically. The option of the vertical header will appear automatically when the report width exceeds the size of the report design dashboard area, and the horizontal scrollbar will show up.
The “Vertical header” button will show up, and you can turn on the report to show the lowest level column headers vertically.
Table header formatting
By default, column widths are set to Auto, automatically adjusting to fit the table within the screen. But you can specify the table header look if needed.
Change the column width
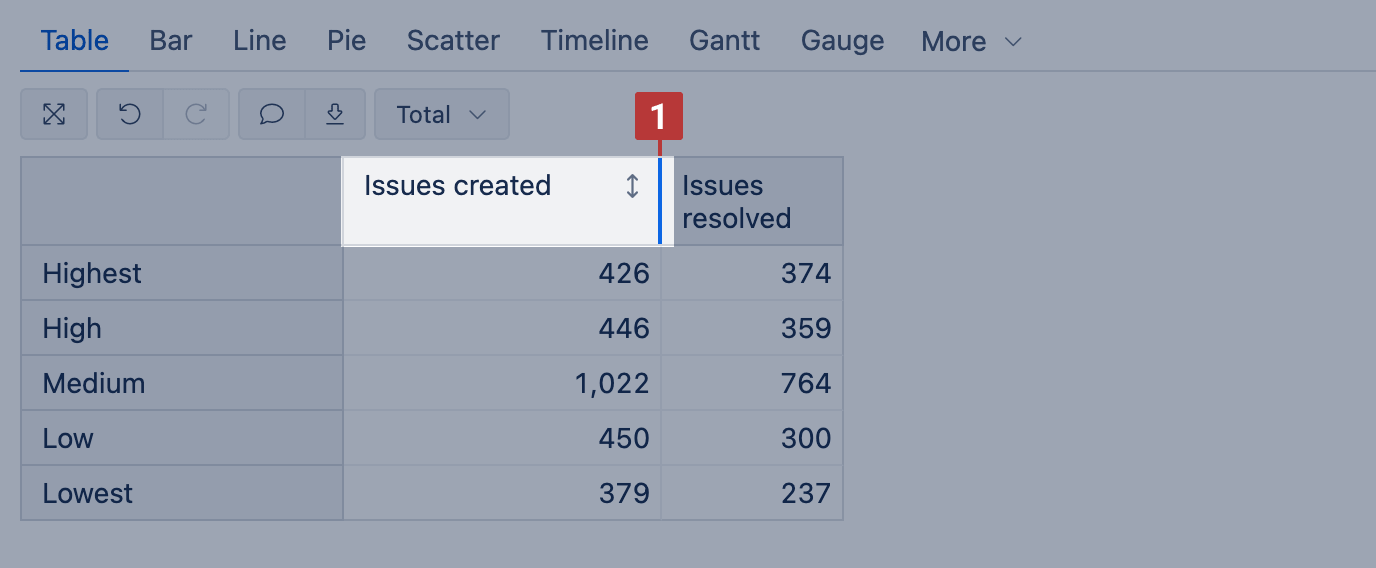
You can resize column width by dragging the right border of the column header [1].
-
Hold Shift while resizing to apply the same width to all headers in the same dimension
-
Double-click the right border to restore the default width
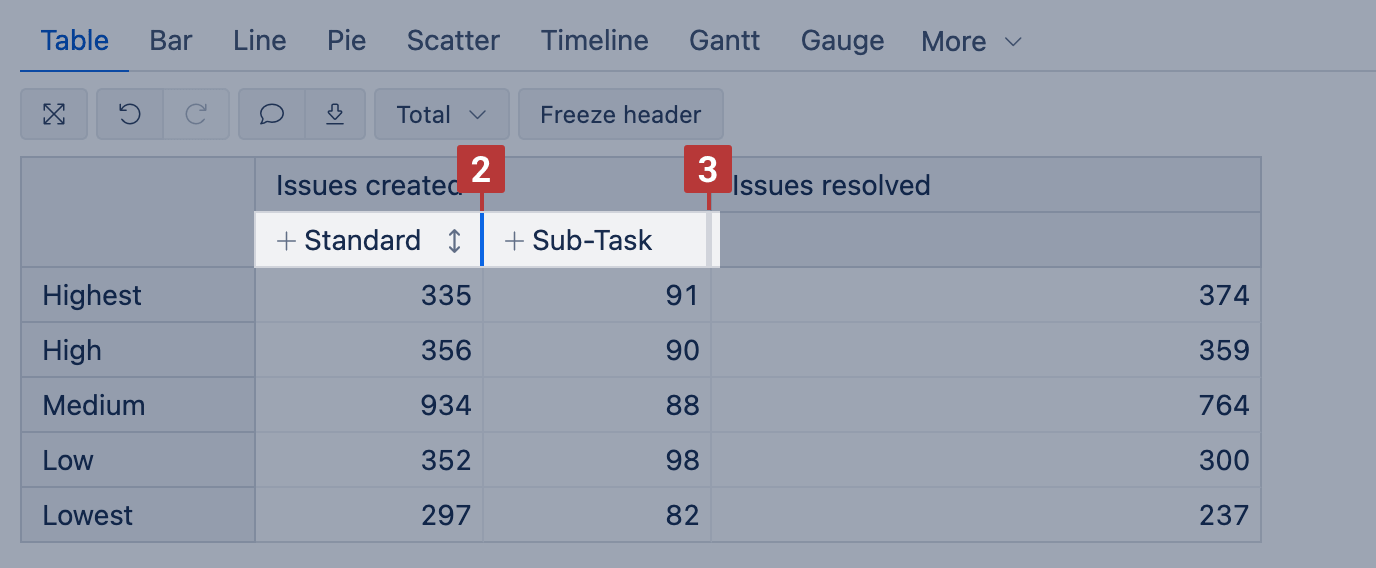
When multiple column dimensions are used, changing the width of a lower-level header [2] restores the higher-level header width to the default.
When you hover over the header, a wider right border highlights that the column width has been changed [3].
Header formatting and color
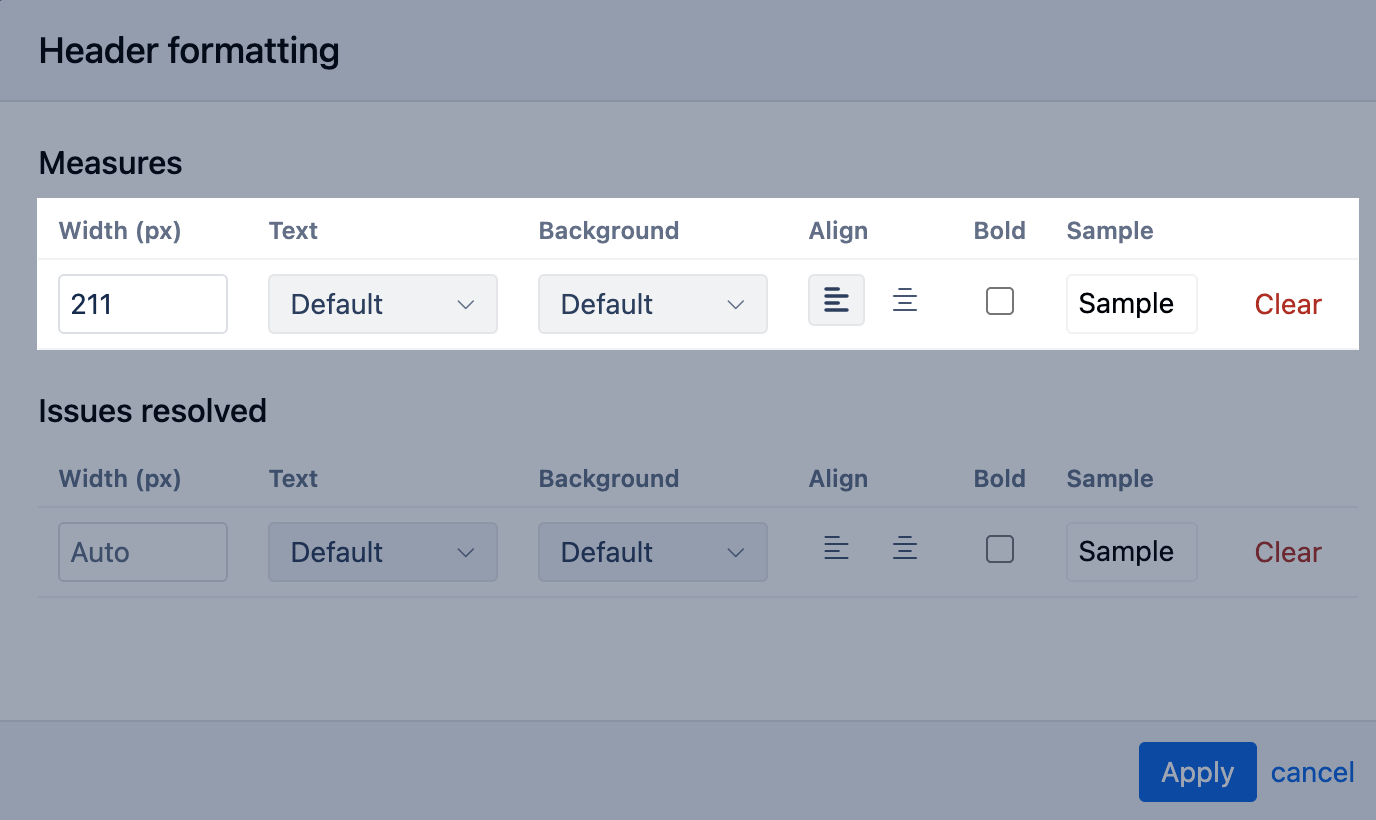
You can specify the text positioning, formatting, and color for column and row headers. Click on the column header or any member name on the report rows to open the header formatting window.
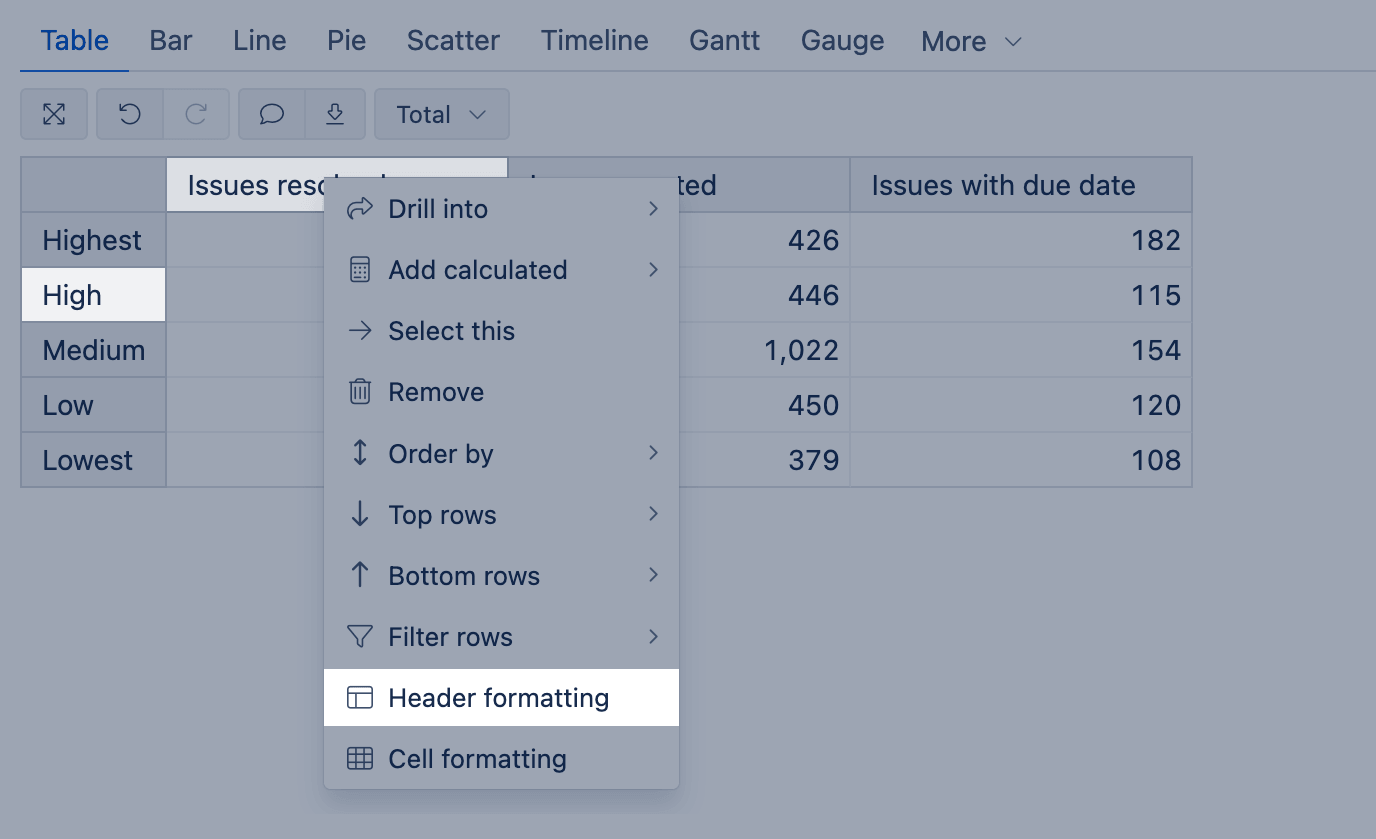
In the header formatting window, you can set formatting for all members, like all Measures on report columns [1], or customize an individual member, specifically the one you click on [2].
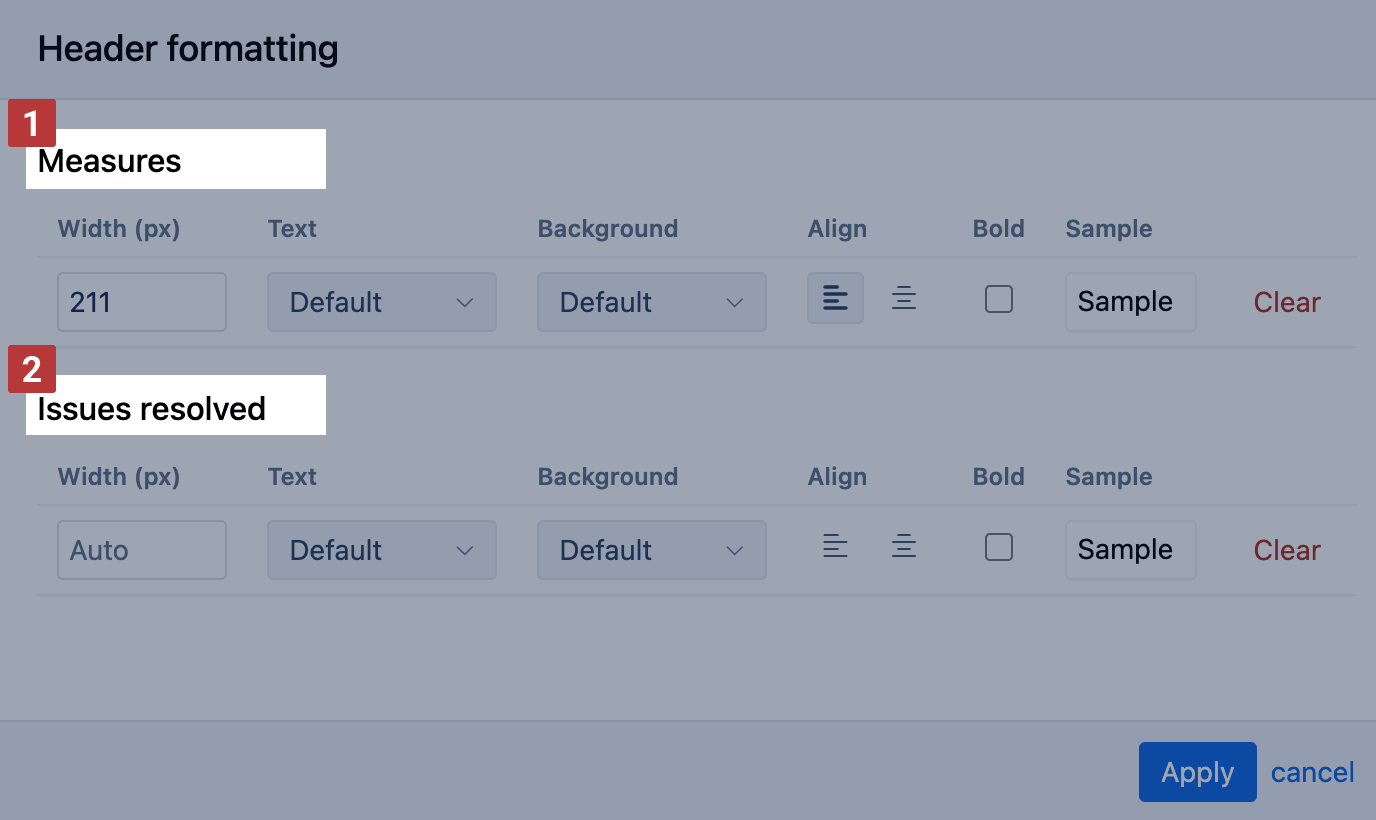
Available options:
-
Set the width in pixels – for row dimensions, the header width can be set only for all members; changing individual member width is not supported.
-
Change the text and background color
-
Align text to the left or center
-
Apply bold formatting – if bold is set for all members, you cannot set an individual member back to regular text
-
Clear all formatting to restore the default options