This page explains, how Odoo reporting is organized in flex.bi business intelligence platform and what can be each reporting Data Cube used for.
To see dashboards in action please visit Odoo Report Template Library.
Odoo Data available in flex.bi connector
Odoo conector is available in http://flex.bi Cloud and Enterprise versions as standard connector that allows to import data seamlessly and get first dashboards in minutes.
Subscription plans: Odoo application is available only in the Business and Premium plans.
See http://flex.bi pricing plans here: https://flex.bi/pricing/
In short: the reporting setup brings together actual work, planned work, and project activity so teams can compare what was scheduled with what was really done.
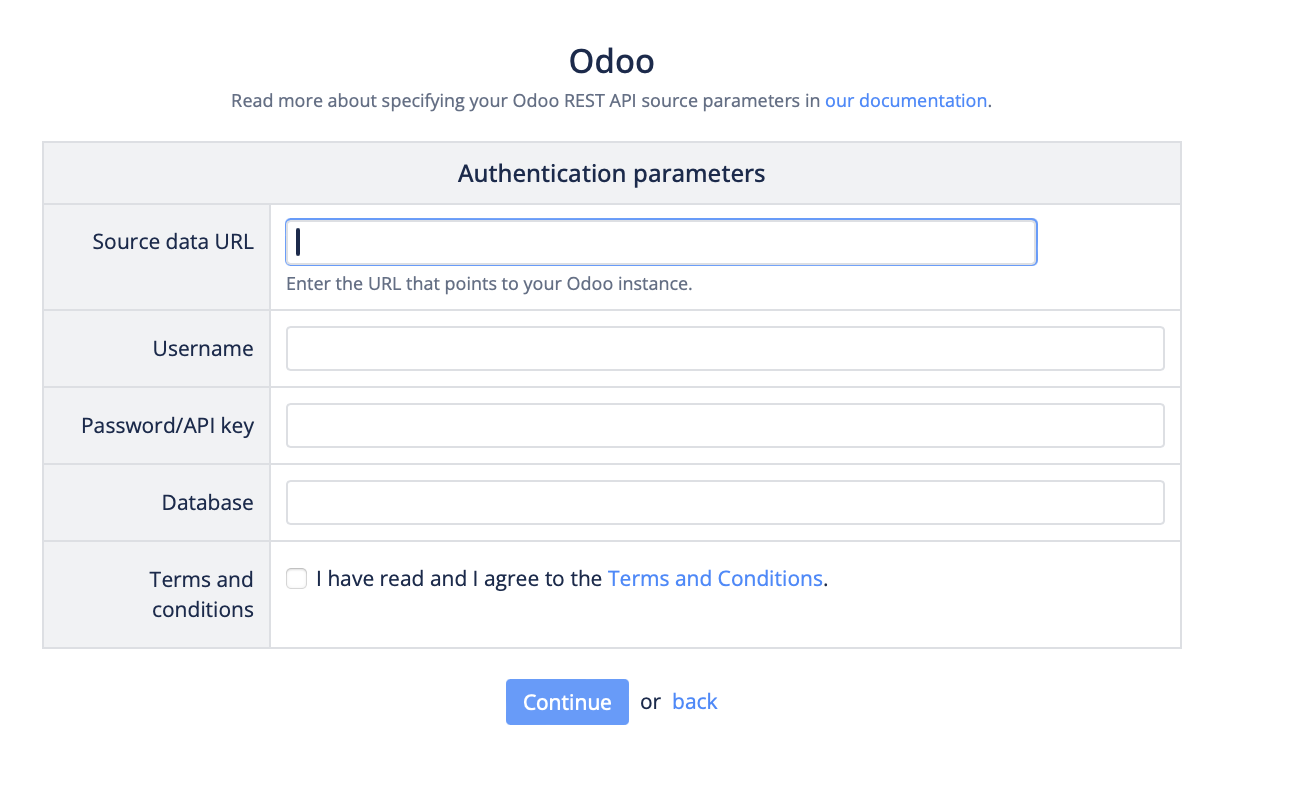
Odoo connector requires URL and log in to connect. You can read more about connecting your Oddo system here: https://docs.flex.bi/support-center/odoo
What this Odoo reporting setup includes
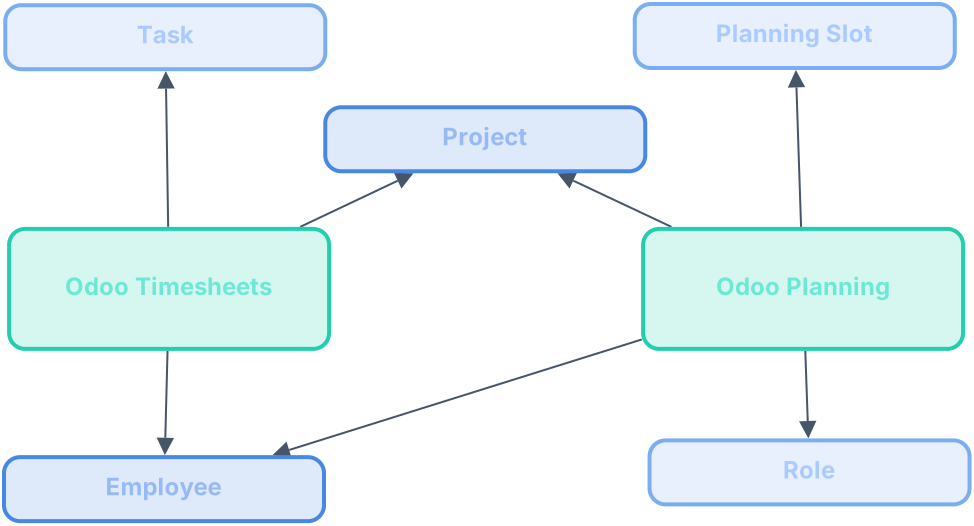
The reporting model is built around two connected reporting areas:
-
Odoo Timesheets for actual time entered by employees
-
Odoo Planning for planned work and scheduled hours
These areas are connected through shared business views such as employee, project, task, role, and date. This makes it possible to analyze work from different angles without maintaining separate reporting structures.
What can you analyse with flex.bi for Odoo dashboards?
Odoo Timesheets
Shows the real time people recorded as worked.
Odoo Planning
Shows the hours that were planned or allocated in advance.
Together, these views help answer questions such as:
-
How much time was planned versus actually spent?
-
Which employees, teams, or roles are carrying the most workload?
-
Which projects or tasks are absorbing the most effort?
-
How accurate is planning over time?
Shared business dimensions
Both reporting areas use common business categories so the data can be compared consistently.
|
Business area |
What it represents |
Why it matters in reporting |
|---|---|---|
|
Employees |
People doing the work |
Lets you analyze workload, utilization, and contribution by person |
|
Employee categories |
Employee groupings or classifications |
Helps compare work across employee types |
|
Departments |
Teams or organizational units |
Supports department-level reporting |
|
Projects |
The projects work is linked to |
Supports project-level tracking and comparison |
|
Tasks |
Specific pieces of work inside projects |
Helps drill down into what people were working on |
|
Roles |
Planning roles used in scheduling |
Useful for planning and staffing analysis |
|
Time |
The date linked to each record |
Enables trend, period, and timeline reporting |
Odoo Timesheets
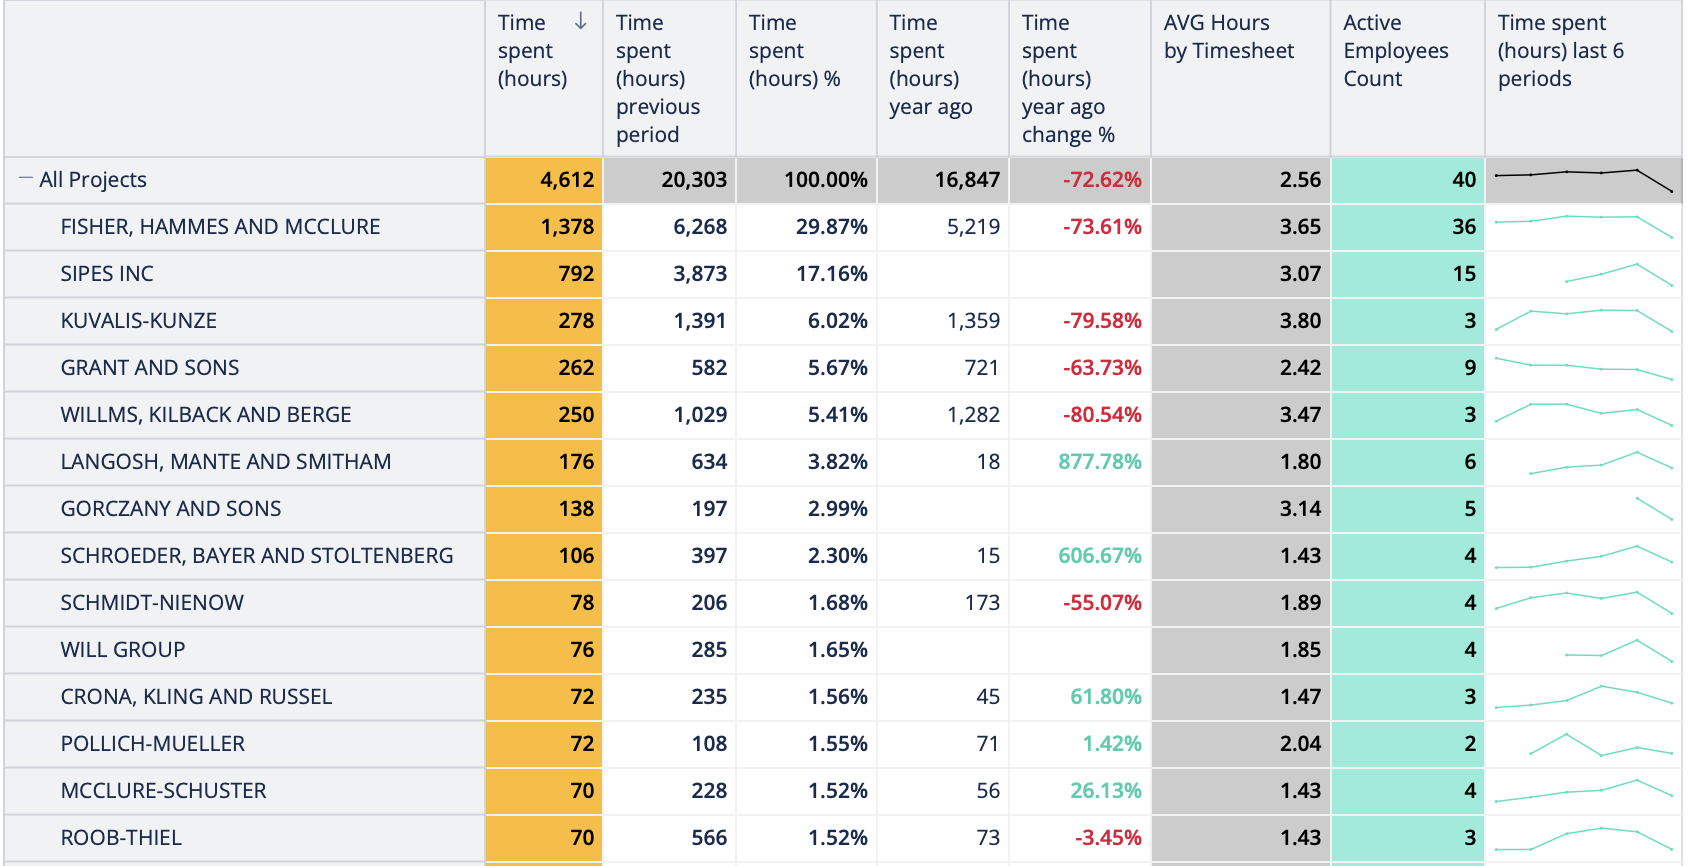
This is the main area for understanding actual work performed. It uses timesheet entries to show how much time employees recorded and where that time was spent.
Best used for: understanding real effort by employee, project, task, department, or time period.
In this reporting area, each timesheet entry is connected to:
-
the employee who entered the time
-
the task the time relates to
-
the project the work belongs to
-
the date the time was recorded
The main measures available are:
-
Timesheet Count — the number of valid timesheet entries
-
Time Spent — the total hours recorded
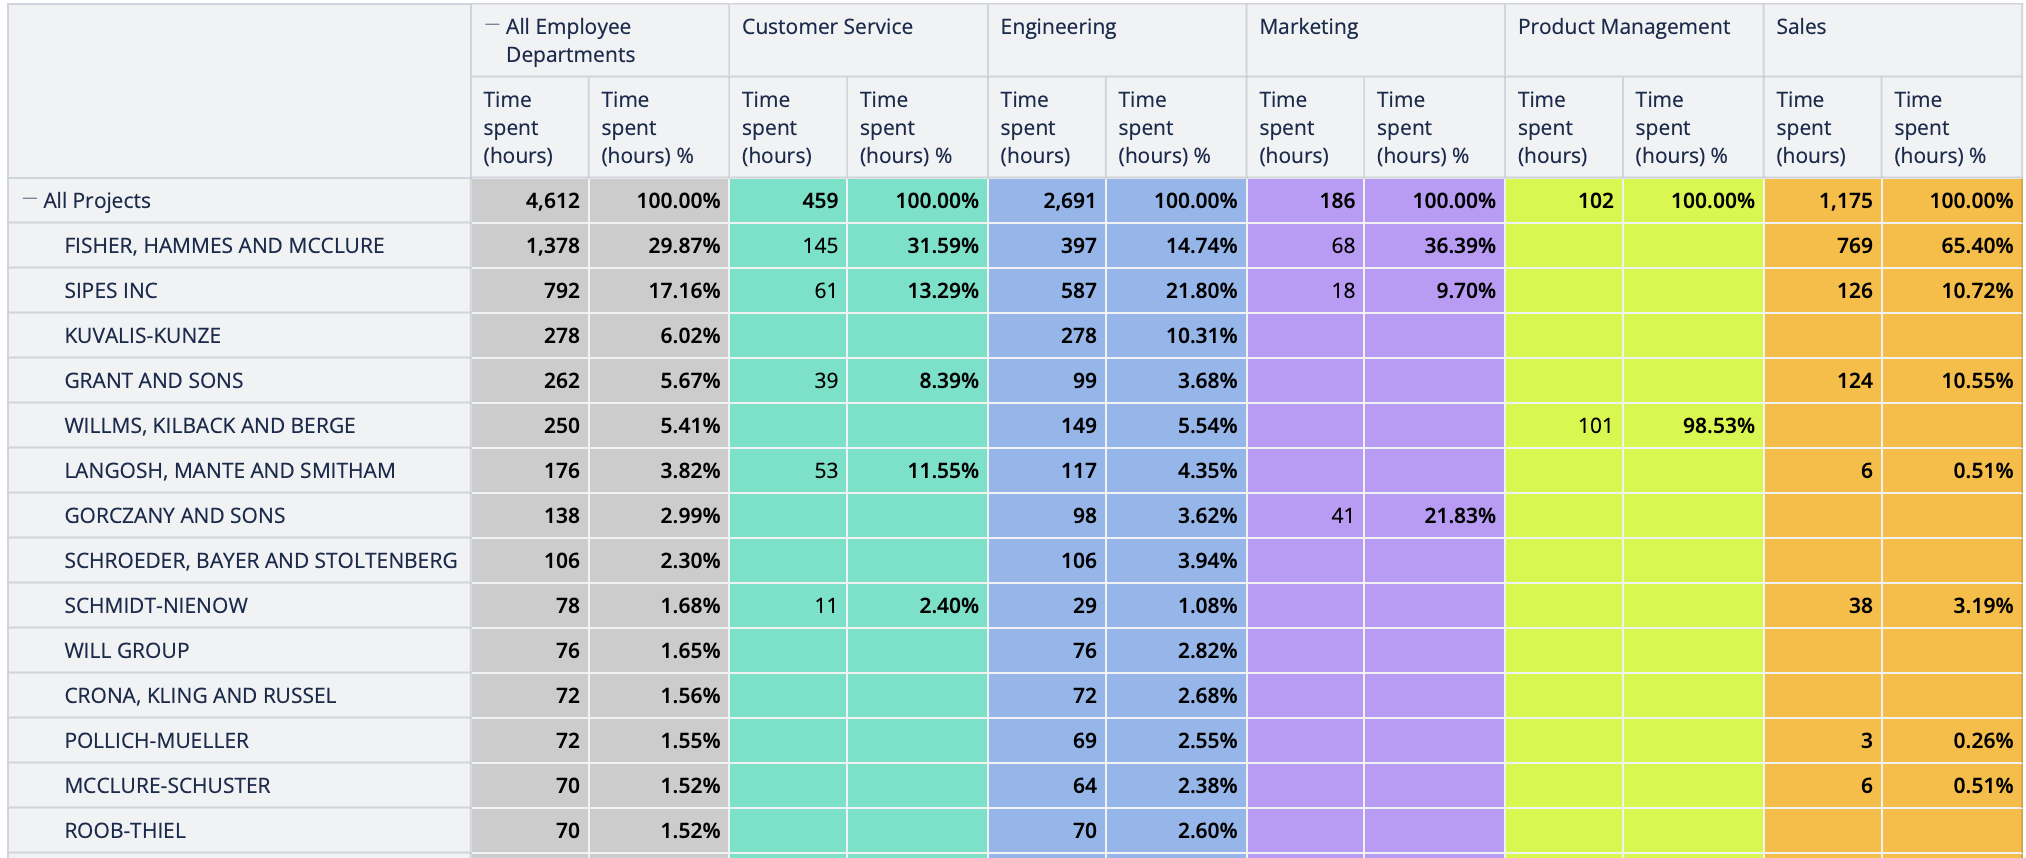
Some records are intentionally excluded from reporting. Entries without an employee or project are skipped, and entries linked to the Internal project are not included.
Odoo Planning
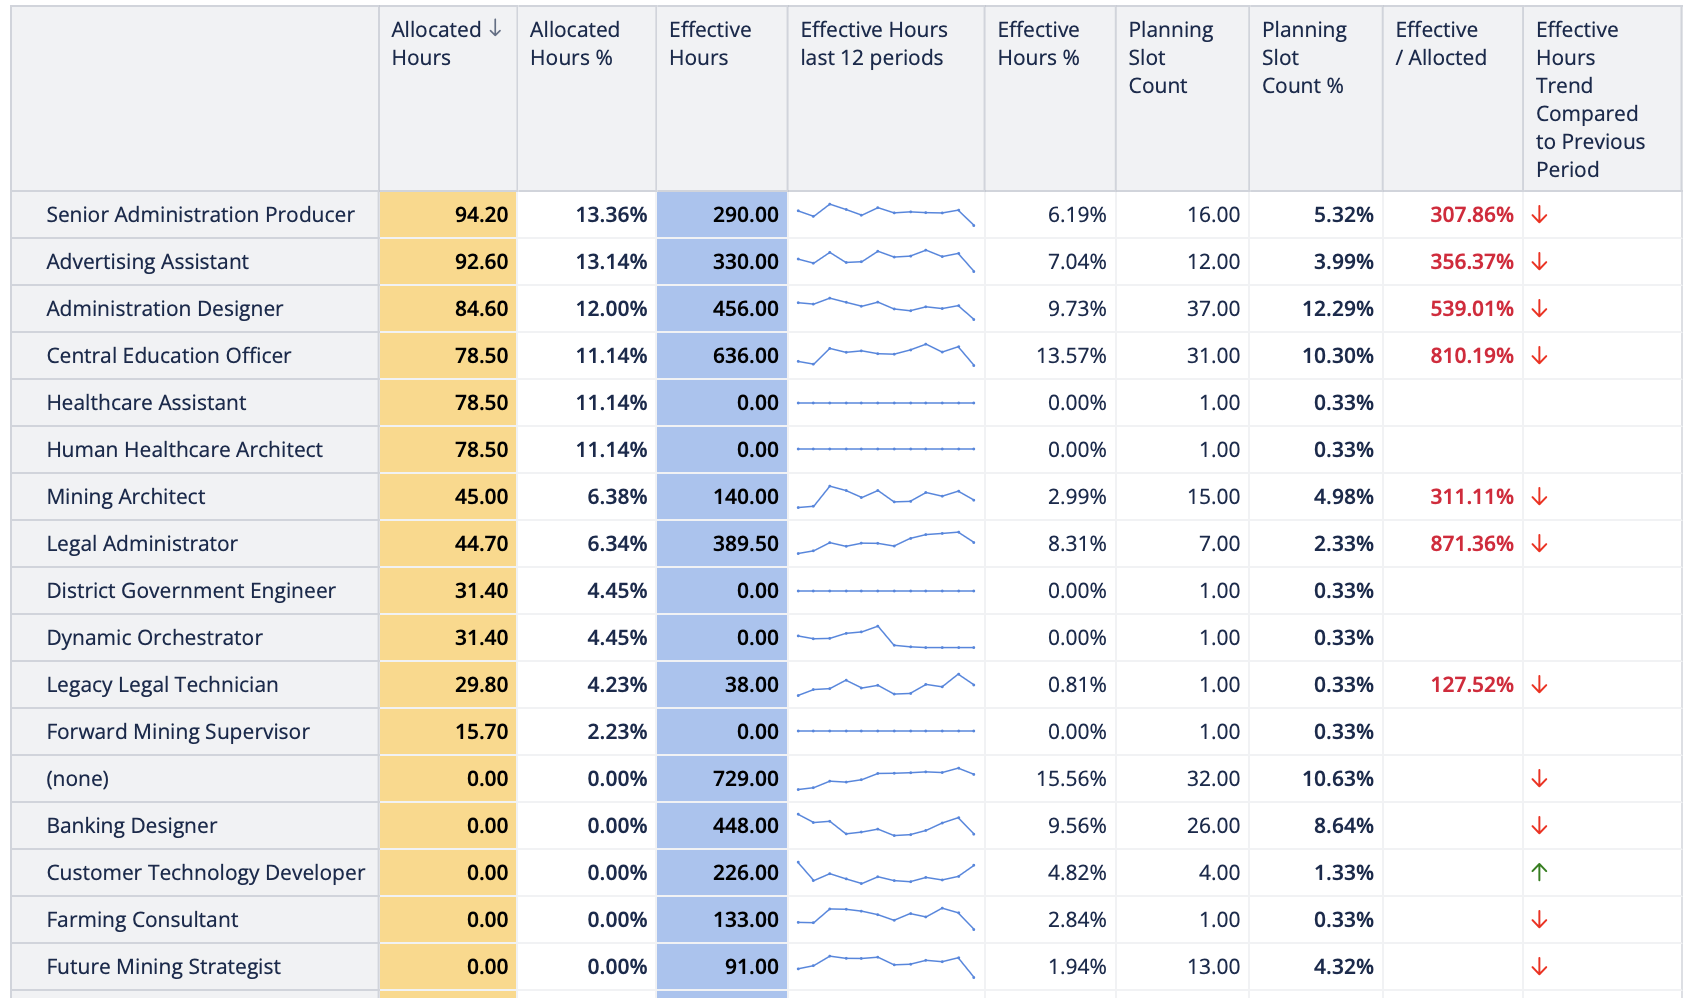
This reporting area focuses on planned work. It uses planning slots to show what work was scheduled, for whom, and for how many hours.
Best used for: comparing expected workload with actual time logged.
Planning records can be analyzed by:
-
employee
-
project
-
role
-
date
The main measures available are:
-
Planning Slot Count — the number of imported planning slots
-
Allocated Hours — the hours originally planned
-
Effective Hours — the actual effective planned hours recorded in planning
Only meaningful planning records are included. For example, the setup imports planning slots only when they have allocated hours greater than zero and are in a usable planning state.
How the reporting areas work together
The biggest strength of this setup is that the reporting areas are not isolated. They share common structures and measures, which makes cross-analysis easier and more reliable.
|
Reporting area |
Main focus |
Typical business question |
|---|---|---|
|
Odoo Timesheets |
Actual work done |
How much time did people really spend? |
|
Odoo Planning |
Scheduled work |
What was planned and for how long? |
Because these reporting areas are aligned, teams can compare:
-
planned hours versus actual hours
-
team workload across departments or employee groups
-
project effort across tasks and time periods
-
role-based planning against real delivery
Important business rules
-
Employees and projects can appear in reporting even if they are no longer active, which helps preserve historical analysis.
-
Status values are made easier to read by showing them as Active or Inactive.
-
Only valid, relevant timesheet and planning records are included.
-
Internal project time is excluded so operational reporting stays focused on customer or delivery work.
What this enables for reporting
With this setup, business users can build reports and dashboards for:
-
utilization and capacity tracking
-
planning accuracy
-
employee workload
-
project delivery effort
-
department and category comparisons
-
task-level execution trends
Outcome: this model gives a clearer picture of who was planned, who worked, where time was spent, and how project effort changes over time.
Adding Other data modules to flex.bi
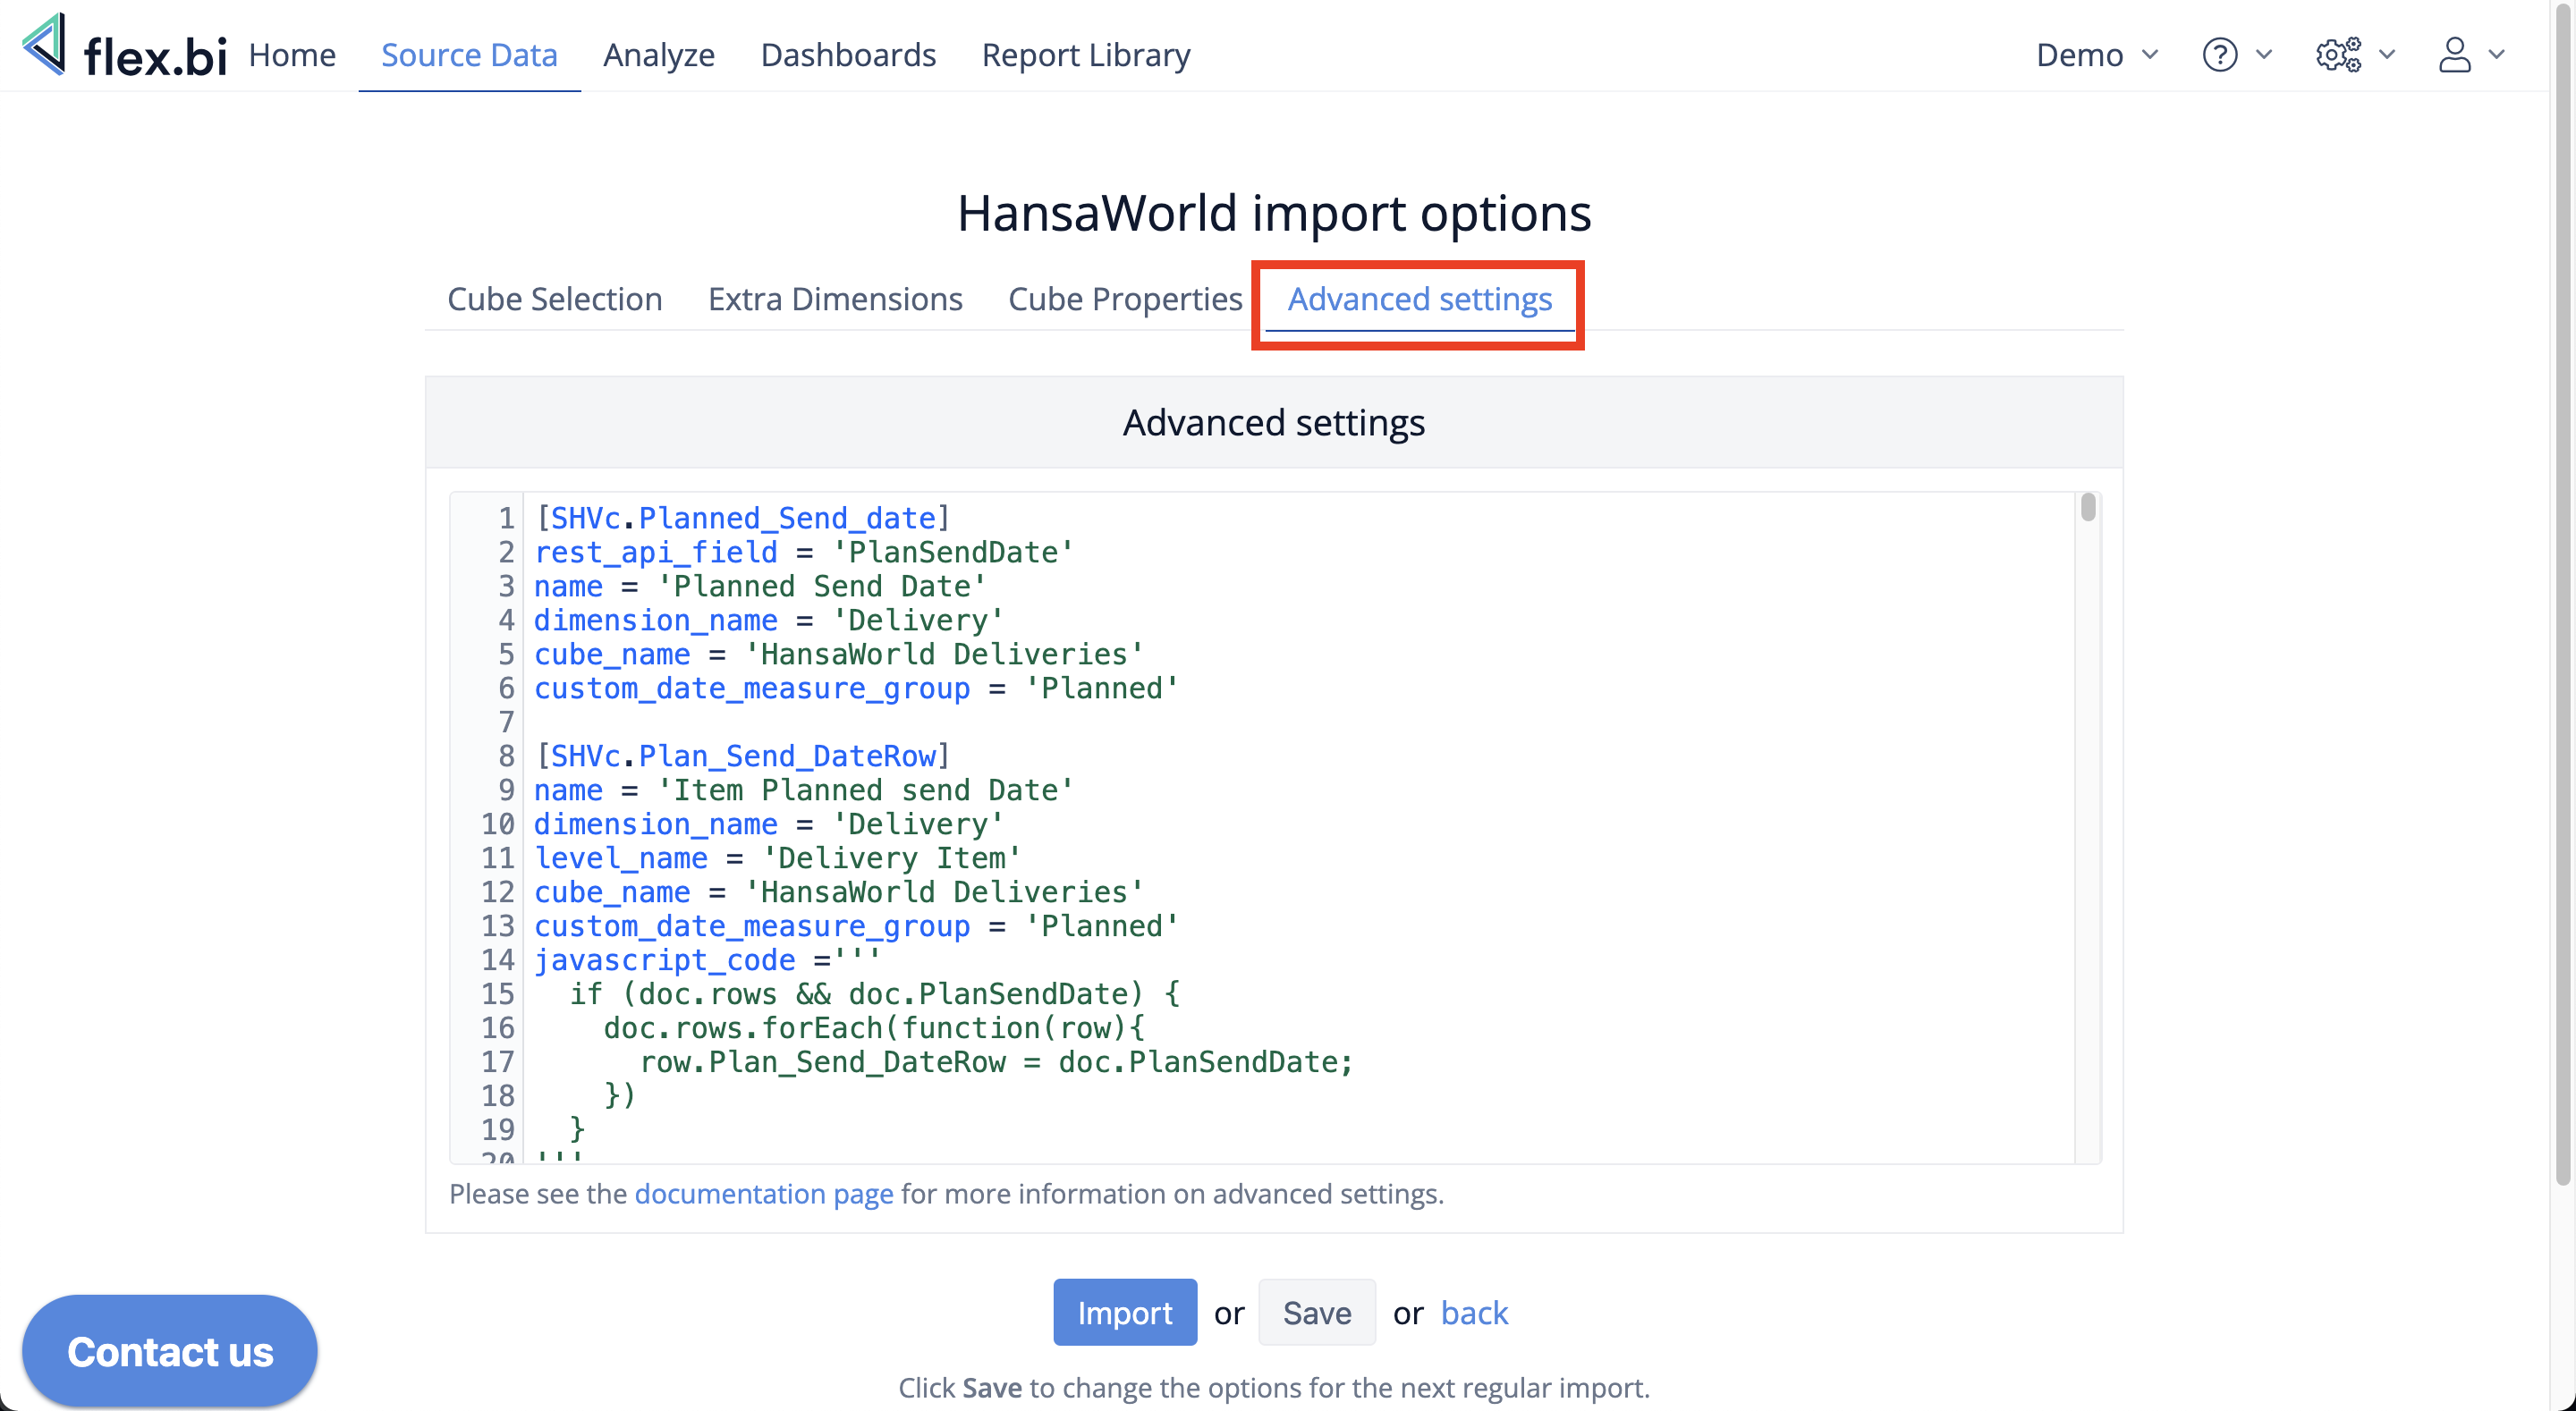
With Advance settings for Custom field functionality you can create other data structures such as - Dimension, Properties, Measures, Hierarchies and New Data cubes.